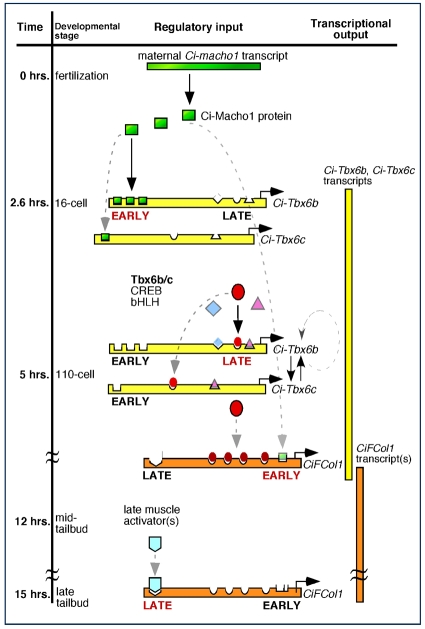
Fig. 5.
A working model for the muscle cis-regulatory hierarchy in Ciona. The regulatory interactions identified by this study are summarized and plotted against the developmental time-course of Ciona embryogenesis at 18°C (black vertical bar on left). Horizontal green bar represents the maternally-deposited Ci-macho1 transcripts, green squares depict the Ci-Macho1 protein. Horizontal bars symbolize the cis-regulatory regions of Ci-Tbx6b and Ci-Tbx6c (yellow) and CiFCol1 (orange); transcription start sites are indicated by horizontal arrows. Transcripts are shown in scheme as vertical bars on the right. Transcription factors are depicted as described in Fig. 2.

