Fig. 7.
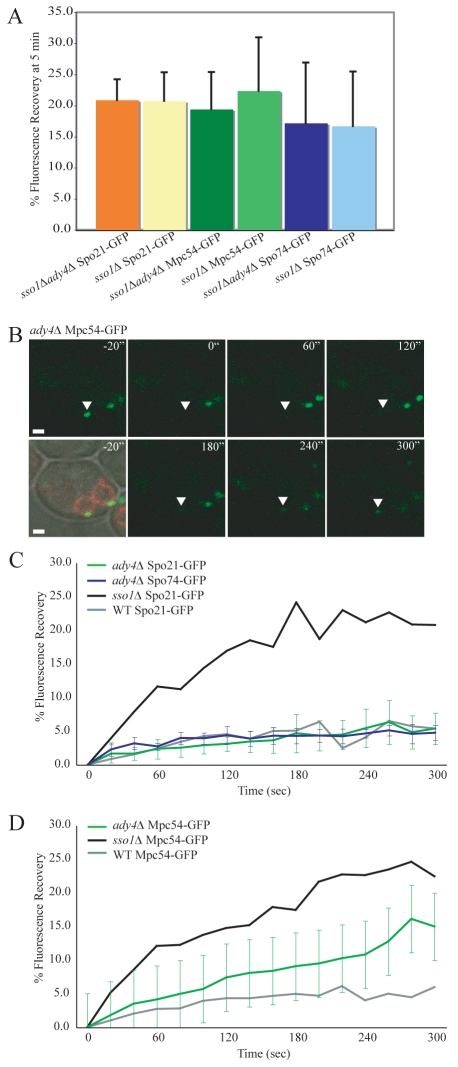
Ady4p retains Mpc54p in the MOP during prospore-membrane growth. (A) Fluorescence recovery at 5 minutes after photobleaching for Spo21p-GFP, Mpc54p-GFP, and Spo74p-GFP. The graph compares fluorescence recovery in sso1Δ ady4Δ double mutants and sso1Δ single mutants. Cells were analyzed during meiosis II. The sso1Δ ady4Δ bars represent the average of nine, seven and nine experiments, respectively from left to right. Fluorescence recovery values of Spo21p-GFP, Mpc54p-GFP and Spo74p-GFP in sso1Δ cells are from Fig. 1B-D. Error bars represent s.d. (B) Representative images from the fluorescence recovery of Mpc54p-GFP in ady4Δ cells. RFP-Spo20p51-91 labels the prospore membrane. Time points are indicated. Pre-bleach images are shown in merged DIC/RFP/GFP channels and the GFP channel alone. The bleached spindle-pole body is marked with an arrowhead. Scale bars: 1 μm. (C) Fluorescence recovery of Spo21p-GFP and Spo74p-GFP in ady4Δ cells. Cells were analyzed during meiosis II. The green Spo21p-GFP plot represents the average of 14 experiments. The dark blue Spo74p-GFP plot represents the average of nine experiments. Fluorescence recovery of Spo21p-GFP in wild-type and sso1Δ cells from Fig. 1B are also shown for comparison. (D) Fluorescence recovery of Mpc54p-GFP in ady4Δ cells. The plot represents the average of 13 experiments. Fluorescence recovery of Mpc54p-GFP in wild-type and sso1Δ cells from Fig. 1D are also shown for comparison.

