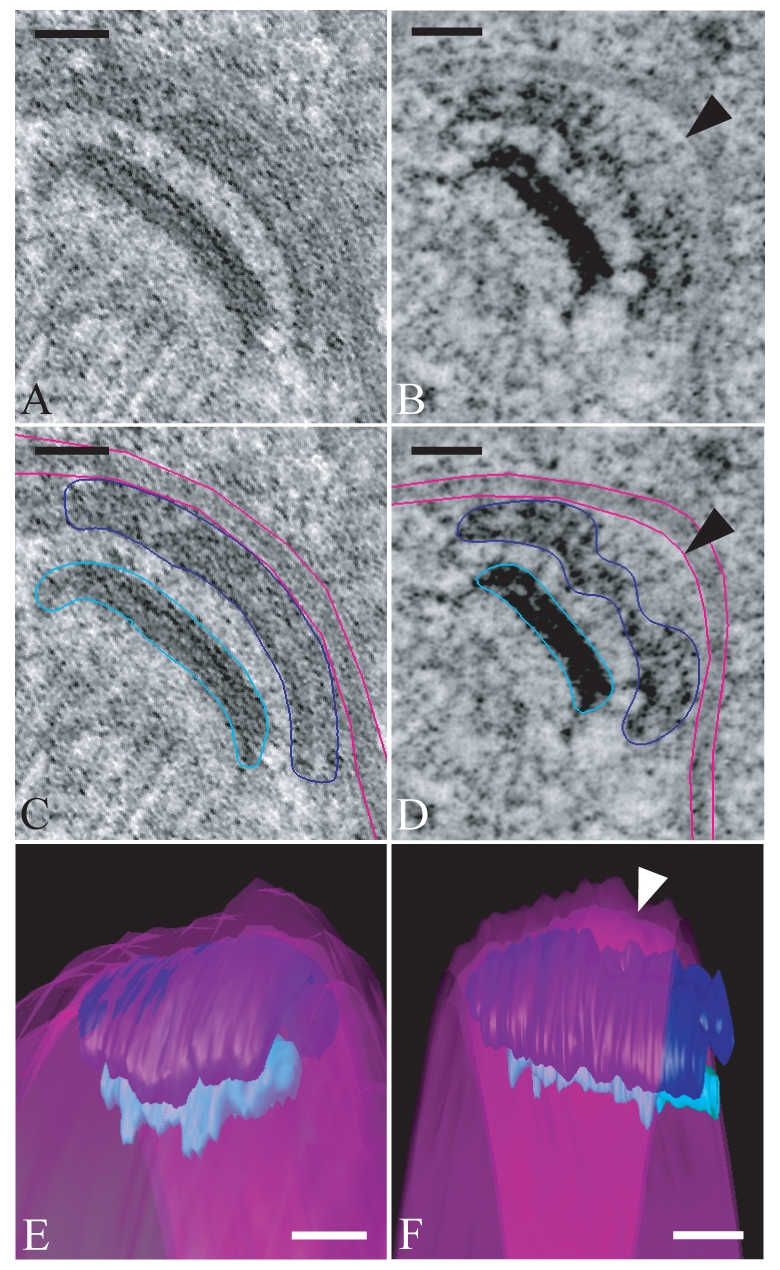
Fig. 8.

Localized disruptions of MOP structure are seen in an ady4Δ mutant. (A) A 10-nm tomographic slice of a meiosis II spindle-pole body in a wild-type cell showing the MOP in close association with the prospore membrane. (B) A 10-nm tomographic slice of a meiosis II spindle-pole body in an ady4Δ cell. Arrowhead indicates an area in which the connection between the prospore membrane and the MOP is lost. (C) Image from A with graphic overlay delineating the position of elements shown in the 3D reconstruction. The MOP (dark blue), prospore membrane (pink) and central plaque (light blue) are shown. (D) Image from B with graphic overlay delineating the position of elements shown in 3D reconstruction. The arrowhead indicates an area in which the connection between the prospore membrane and the MOP is lost. Color assignments are as in C. (E) Reconstruction based on the tomogram in A demonstrating the close association of the prospore membrane across the entire MOP surface. Color assignments are as in C. (F) Reconstruction based on the tomogram in B. The area of separation of the prospore membrane from the MOP surface is indicated by an arrowhead. Color assignments are as in (C). Scale bars: 50 nm. For movies of the complete tomograms and models available see supplementary material Movies 1-6.
