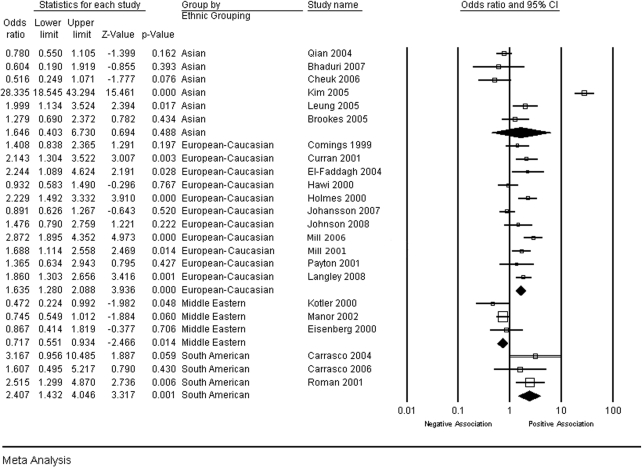
Fig. 1.
Papers have been grouped into one of the following racial categories: Asian, European-Caucasian, Middle Eastern and South American. Darkened diamonds correspond to group values while the white squares and line that cross through show the OR for each paper and the corresponding confidence interval.

