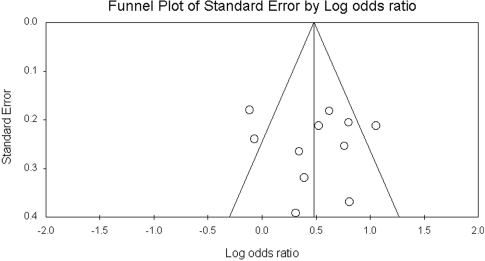
Fig. 3.
Publication Bias measures the tendency that significant results are published while those that are not significant are kept from publication. This graph measures the publication bias of the European–Caucasian group. A scatterplot shaped similar to the Isosceles triangle indicates little publication bias, while a scatterplot that varies from the triangle shows that publication bias is an issue. This figure shows that publication bias is an issue in reporting the relationship between ADHD and the 7R allele.

