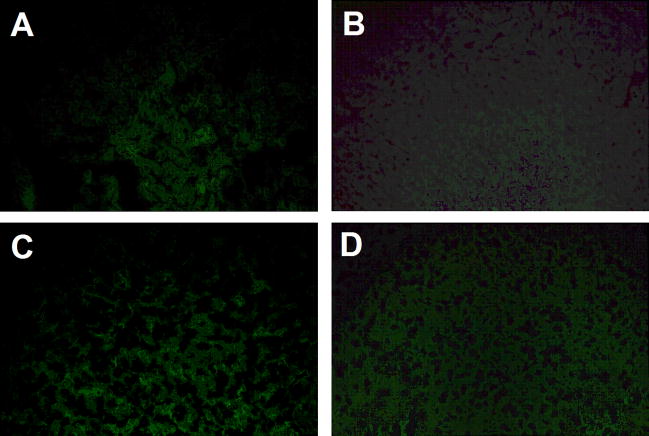
Fig. 4.
Panel A and B: control staining, and panel C and D: TSH staining of panel A and C: liver, and panel B and D: kidney tissue sections from the same animal used for jejunal sections in Fig. 1, panel A, C, and D. In general, TSH staining was minimal or absent compared to background staining. The low level of background staining may be due to binding of streptavidin-FITC to endogenous biotin in the liver and kidney. Results are representative of three mice. Magnifications: panel A–D, 200x.

