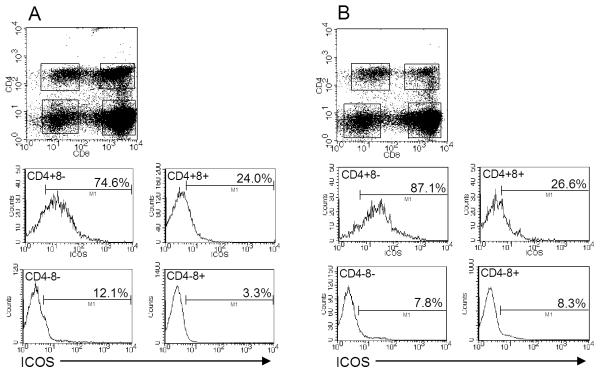
Fig. 4.
Three-color flow cytometric analysis of small intestinal IELs from (A) non-infected and (B) day 7 reovirus-infected mice. Note that ICOS expression is primarily associated with the CD4+8- IEL population, and that there is an increase in expression on that population in day 7 infected mice compared to non-infected animals. Similar findings to these were observed from mice at day 6 post infection (data not shown).

