
Figure 4.
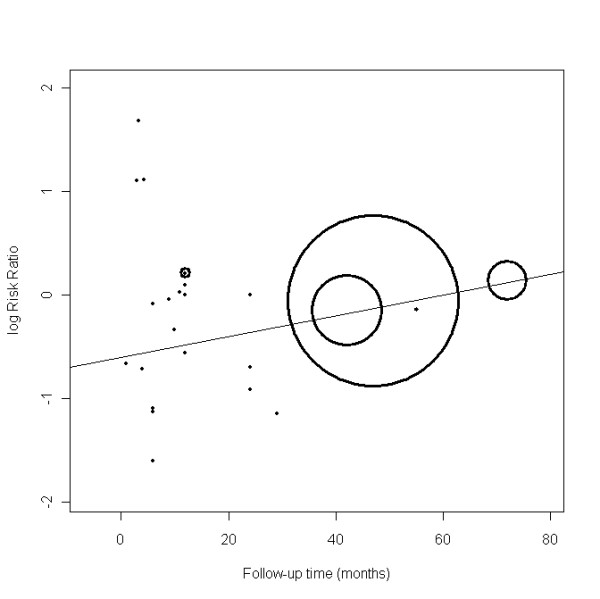
Scatter plot of the change in log (risk ratio) for all-cause mortality with median follow-up time. Weights in the scatter plot are proportional to the inverse of the variance of each study's log (risk ratio).
Official websites use .gov
A
.gov website belongs to an official
government organization in the United States.
Secure .gov websites use HTTPS
A lock (
) or https:// means you've safely
connected to the .gov website. Share sensitive
information only on official, secure websites.
Scatter plot of the change in log (risk ratio) for all-cause mortality with median follow-up time. Weights in the scatter plot are proportional to the inverse of the variance of each study's log (risk ratio).