
Figure 1.
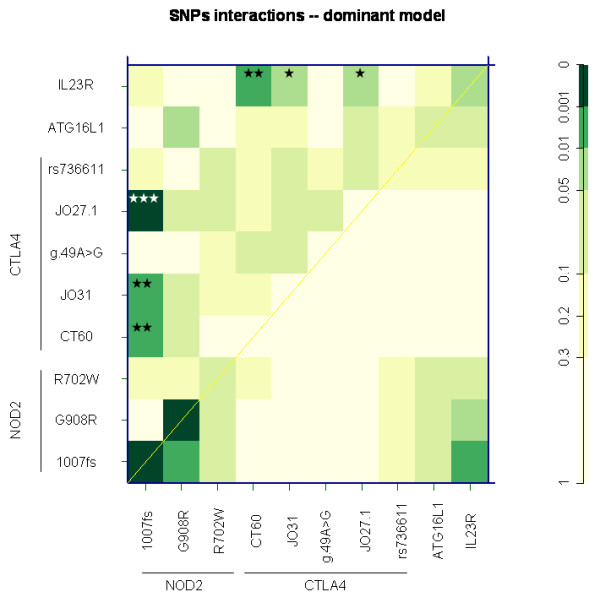
SNPs interaction in the dominant model. The upper triangle in matrix from this function contains the p values for the interaction (epistasis) log-likelihood ratio test (LRT). The diagonal contains the p values from LRT for the crude effect of each SNP. The lower triangle contains the p values from LRT comparing the two-SNP additive likelihood to the best of the single-SNP models [24]. P value of interactions: * P < 0.05; ** P < 0.01; *** P < 0.001.