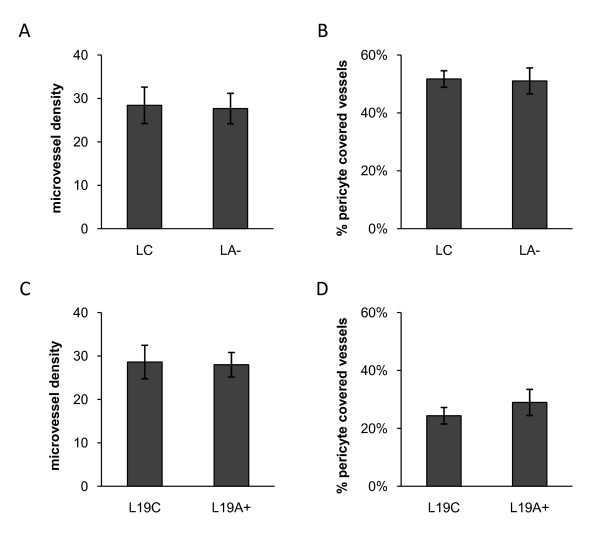
Figure 5.
Microvessel density and pericyte covered blood vessels in tumor xenografts. (A, C) Microvessel density. Blood vessels were stained for CD34 and the number of vessels was counted in five fields of each tumor in light microscopy at 200 × magnification. Results are presented as mean number of vessels per field ± SEM. (B, D) Percentage of pericyte covered blood vessels. Blood vessels were double stained for CD34 and α-SMA. The number of α-SMA positive blood vessels were counted and divided with the total number of CD34 positive vessels in five fields of each tumor at 200 × magnification. Results are presented as mean ± SEM. (A-B) Control transfected LNCaP (LC, n = 8) and shRNA-transfected LNCaP (LA-, n = 6). (C-D) Control transfected LNCaP-19 (L19C, n = 8) and ADAMTS1 transfected LNCaP-19 (L19A+, n = 7).

