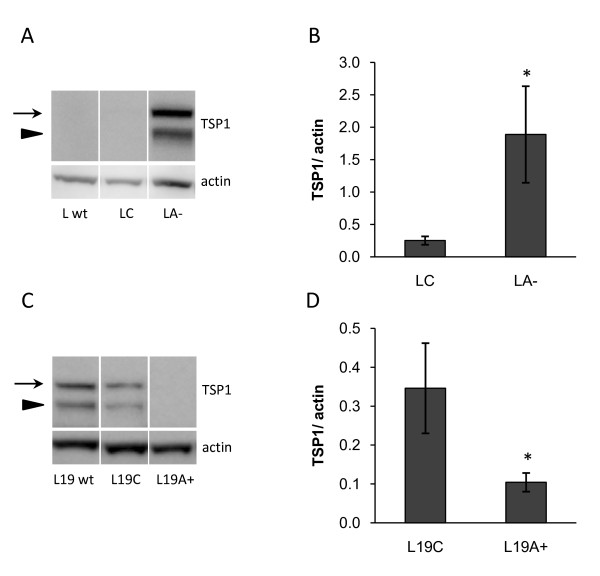
Figure 6.
TSP1 levels in tumor xenografts. (A, C) TSP1 levels in tumor xenografts were analyzed by western blotting. TSP1 was detected in its full-length form (145 kDa, arrows) as well as in a smaller cleaved form (110 kDa, arrowheads). Actin was used as loading control. Western blotting membranes showing one representative sample from each group. (B, D) Densitometric analysis presented as relative levels of TSP1 to actin. Results are presented as mean ± SEM. Mann Whitney U test was used to compare differences between groups, * = P < 0.05. (A-B) LNCaP tumors from LNCaP wild-type (L wt, n = 8), control transfected cells (LC, n = 8) and ADAMTS1 shRNA-transfected cells (LA-, n = 6). (C-D) LNCaP-19 tumors from LNCaP-19 wild-type (L19 wt, n = 6), control transfected cells (L19C, n = 8) and ADAMTS1 transfected cells (L19A+, n = 6).

