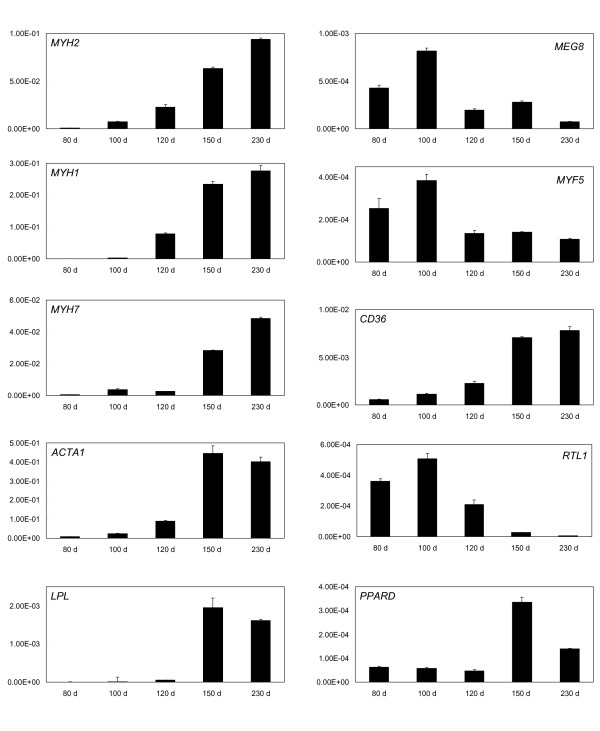
Figure 4.
qRT-PCR expression patterns for selected genes not represented or not reporting on the microarray. The mRNA expression patterns of genes that were not represented or not reporting on the microarray were measured by qRT-PCR. The expression levels were expressed as mean normalised expression (MNE) values relative to 18S RNA. Fetal samples at 80, 100 and 120 days of development and postnatal samples at 150 d and 230 d of development are shown. The result for each gene shows the mean (n = 3), while the error bar denotes 1 S.D.

