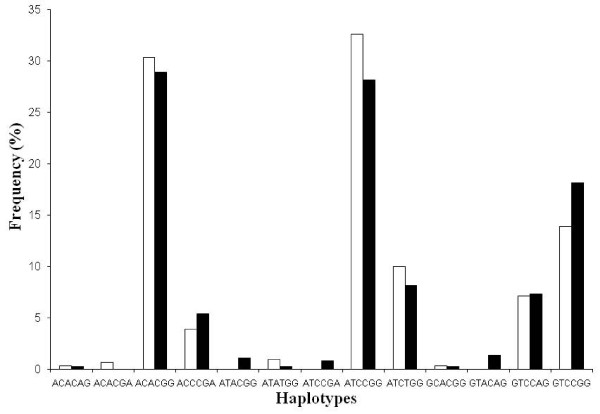
Figure 1.
The frequency distribution of the haplotypes of the TNFA and LTA genes. The frequency distribution of the haplotypes of the TNFA and LTA genes in tuberculosis patients (dark bars) and unrelated controls (light bars). The haplotypes have been plotted on the x-axis and their respective relative frequencies (%) on the y-axis.

