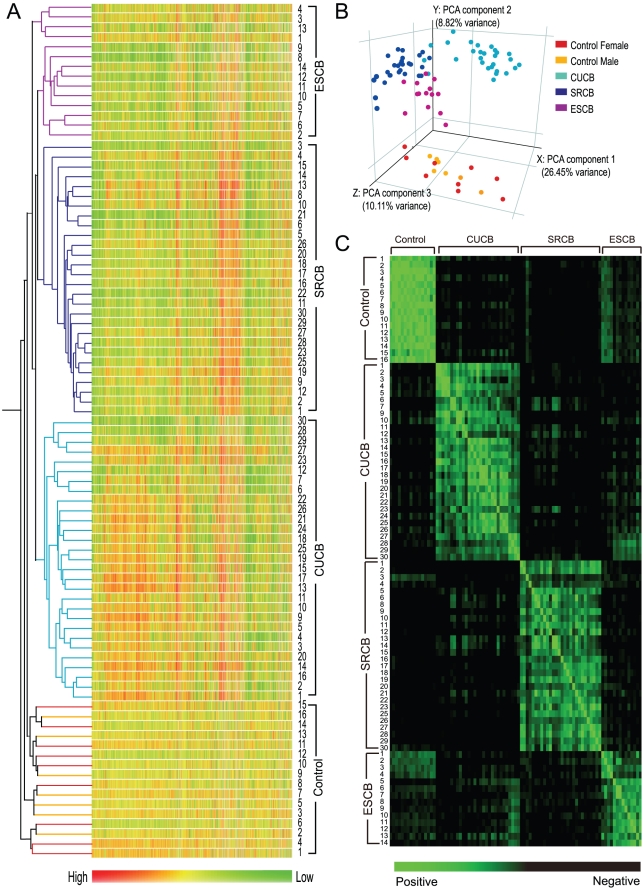
Figure 1. Gene Expression Profile Analysis of Individual Blastocysts.
(A) Hierarchical clustering of all the SECNT samples. CUCBs: n = 29; SRCBs: n = 28; ESCBs: n = 14, and control blastocysts: n = 16. Colors correspond to the relative RNA abundance for more than 39,000 transcripts. Numbers marked beside each profile are individual figures of samples. (B) Principal component analysis of gene expression in all the samples subjected to the hierarchical clustering analysis. (C) Correlation matrix based on the Pearson coefficient of correlation between 2 corresponding samples. The correlation between samples is shown by a color scale ranging from green (positive correlation) to black (negative correlation). The coefficients of correlation are provided in Table S4.

