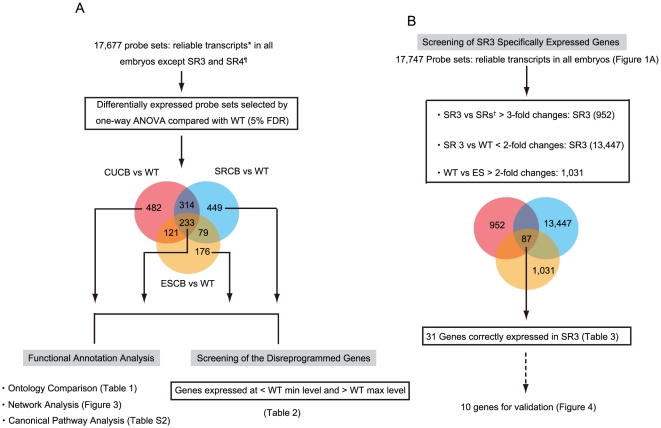
Figure 2. Flow Chart Depicting the Screening of Inappropriately Reprogrammed and SR3-specific Genes.
*: > raw signal intensity value of 100 for at least 1 embryo. (A) ¶: The number of probe sets was obtained from the all microarray data, excluding those for SR3 and SR4, because the gene expression profiles of these embryos were remarkably similar to those of the controls (Figure 1A). (B) †: SRs indicates all embryos cloned from SR cells, except SR3 and SR4.

