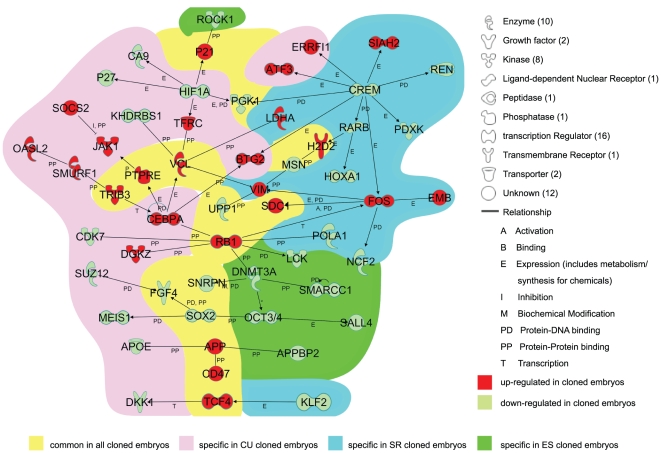
Figure 3. Network of Differentially Expressed Genes.
The network was constructed by direct connection only. Background color represent the genes differentially expressed in all cloned embryos (yellow), CUCBs (pink), SRCBs (blue) and ESCBs (green). The red-colored symbols represent the genes upregulated in the cloned embryos and the light-green-colored symbols represent the downregulated ones.

