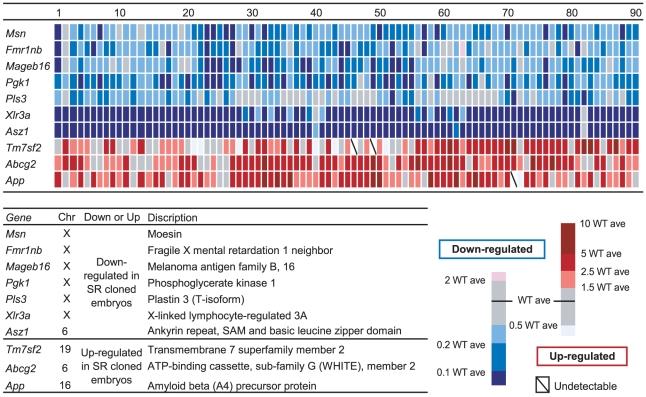
Figure 4. Validation of the Expression Level of Genes Inappropriately reprogrammed in SRCBs.
This figure shows expression levels of the 10 genes in the 90 individual SRCBs. The intensity of the blue and red color gradient indicates down- and upregulated expression levels of the genes. The description of the genes tested is presented in the Figure.

