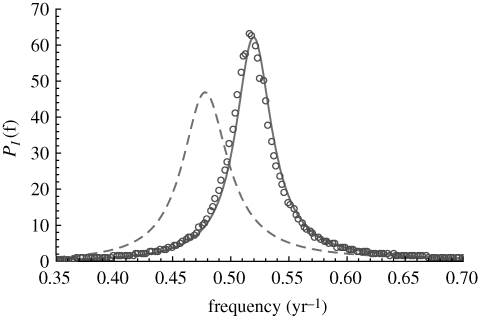
Figure 2.
Theoretical power spectrum (solid curve) for the staged SEIR model parametrized for measles, with results from simulations (open circles). The dashed curve is the standard SEIR result, assuming exponentially distributed exposed and infectious periods. The shift in period is from 1.9 to 2.1 years. Transient periods are discarded before evaluating the numerical spectrum; parameters are as in figure 1.

