Figure 1.
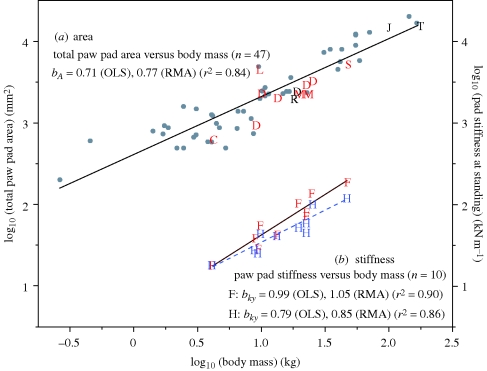
Scaling of total m-p (paw) pad area and stiffness with body mass. (a) Across the range of body size in digitigrade carnivorans, m-p pad area increases more slowly than body mass (slope less than 1; OLS, ordinary least squares; RMA, reduced major axis). Although scaling of total foot area is not shown here it shows a very similar pattern, with b = 0.76, CI: 0.70–0.83. Analyses of phylogenetically independent contrasts using a variety of models and assumptions also yielded values for the slope that fell within the CI of the slopes for phylogenetically un-transformed data; see the electronic supplementary material, table S1.1 and §4. These scaling relationships would lead to an increase in tissue stress and strain in large animals if material properties remain unchanged (i.e. according to H2). Superimposed on area data from 47 digitigrade carnivoran species (grey circles) are data for individual specimens that were available for measurements of thickness (n = 14 adults; C: cat; D: dogs (n = 6); J: jaguar; L; clouded leopard; M: maned wolves (n = 2); R: caracal; S: spotted hyena; T: tiger) or for both thickness and mechanical testing (n = 10 adults, in red). For the tiger specimen, only the fore m-p pad was available and total area shown here is the species mean. (b) In fact, however, fore (F) and hind (H) m-p pad stiffnesses scale differently from each other (ANCOVA, p = 0.04), and both have scaling factors greater than those predicted by H2 (figure 3a and table 2). In the forepad, the scaling factor ≈ 1 maintains similar impact loading regimes among animals of all sizes.

