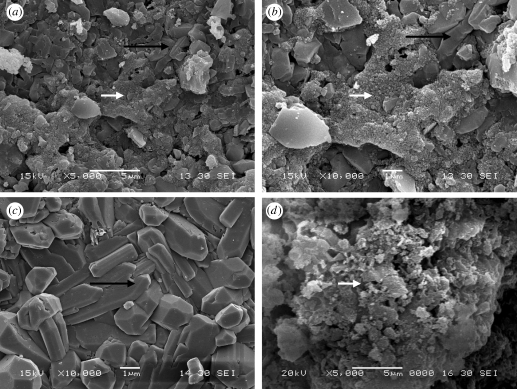
Figure 5.
SEM images of the morphology and microstructure of MCPB after setting for 7 days with a P/L mass ratio of 2.8 g g−1 under different magnifications (a, 5000× and b, 10 000×); long arrow represents Mg3(PO4)2; short arrow represents Ca3(PO4)2. Mg3(PO4)2 (c, 10 000×) and Ca3(PO4)2 (d, 5000×) as controls.

