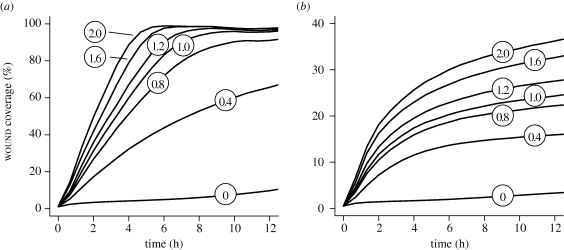
Figure 7.
Changes in cell speed and their effect on simulated wound closure. Simulation details and measurement mappings are the same as in figure 5. (a) Shown are wound closures by factor-responsive cells at different migration speeds. Circled numbers represent cell speed in grid unit per cycle. Wound closure results in figures 5 and 6 used cell speed of 1 grid unit per cycle. Increasing that speed led to more rapid wound closure. Decreasing cell speed slowed the closure. (b) Wound closures by randomly migrating cells at different speeds are shown. Increasing cell speed improved wound healing but failed to reach 50% closure in 12 h. Individual curves represent mean values of 100 Monte Carlo runs.

