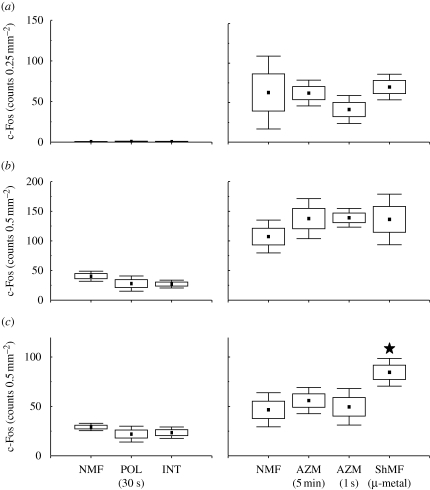
Figure 9.
Number of c-Fos-IR cells in the striatum and primary motor and primary somatosensory cortices. See caption of figure 3 for explanation. Closed asterisks indicate comparison with a control group of animals exposed to the local geomagnetic field. (a) Caudate putamen (striatum) (CPu); (b) primary motor cortex (M1); (c) primary somatosensory cortex (S1).

