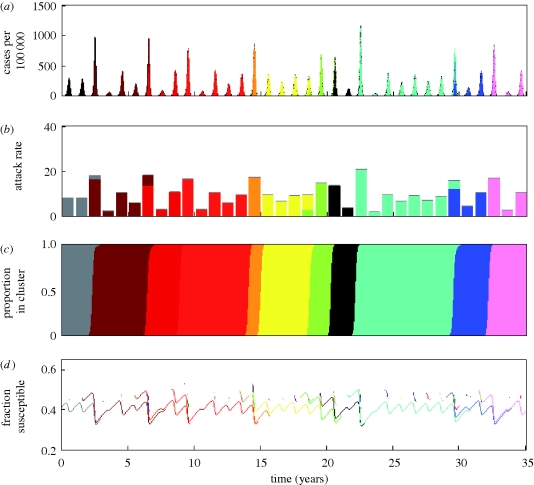
Figure 3.
Epidemiological submodel simulation under a model of punctuated and gradual antigenic evolution. (a) Simulated case dynamics. (b) Simulated annual attack rates. (c) Proportion of cases belonging to each antigenic cluster. (d) The fraction of hosts susceptible to each antigenic cluster, shown over the lifespan of each cluster. Parameters used were as in figure 2, with the exception of γ, which here is γ = 1/8 yr−1.

