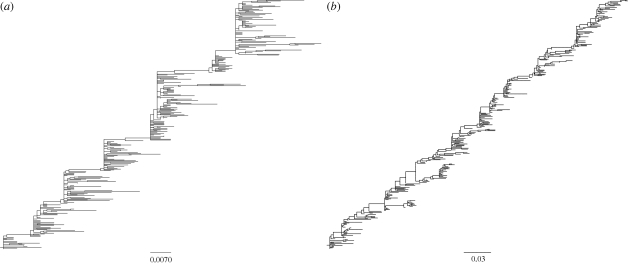
Figure 4.
Phylogenies inferred from sequences simulated by the molecular evolution submodel. (a) Phylogeny inferred from sequences simulated under a model of purely punctuated antigenic evolution (f = 0). (b) Phylogeny inferred from sequences simulated under a model of punctuated and gradual antigenic evolution (with f = 0.01). Both phylogenetic trees were inferred from 300 simulated HA sequences of length l = 987 nucleotides, spanning 35 years. In both simulations, mnuc = 5.7 × 10⁻³ mutations per nucleotide site per year (Fitch et al. 1997), and GTR + I + Γ parameters were set to those estimated from the H3N2 phylogeny shown in figure 1c. These were: (πA, πC, πG, πT) = (0.35, 0.22, 0.21, 0.22), transition rates: AC = 1.21, AG = 4.75, AT = 0.62, CG = 0.17, CT = 4.52, GT = 1, gamma distribution parameter α = 1.21 and proportion of invariant sites f0 = 0.28.

