Figure 5.
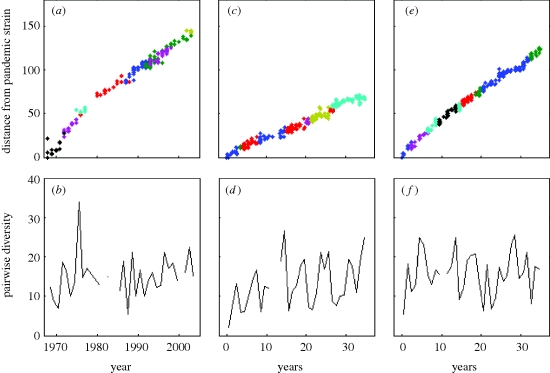
Divergence and diversity patterns of empirical and simulated HA sequences. (a) Divergence of observed HA sequences from influenza A (H3N2) strain BI/16398/68, coloured by antigenic cluster. (b) Diversity of observed HA sequences over time. (c) Divergence of simulated HA sequences from the initial strain, coloured by antigenic cluster, for the purely punctuated model of antigenic evolution. (d) Diversity of simulated HA sequences over time for the purely punctuated model of antigenic evolution. (e) Divergence, as in (c), with sequences simulated from the model of punctuated and gradual antigenic evolution. (f) Diversity, as in (d), with sequences simulated from the model of punctuated and gradual antigenic evolution. For all plots, divergence is defined as the Hamming distance from each sequence to the reference strain, and diversity is defined as the average pairwise nucleotide distance of sequences sampled in a given year.

