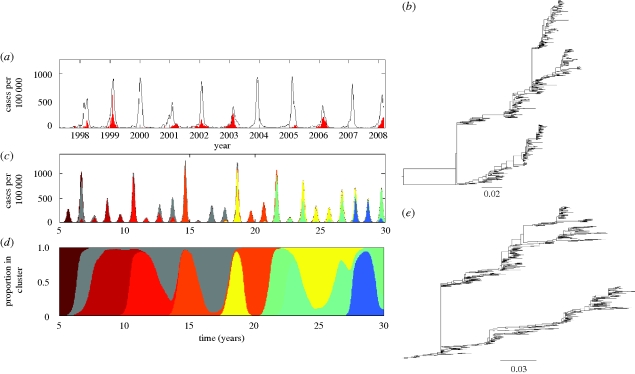
Figure 6.
Observed versus simulated dynamics of influenza B in humans. (a) As in figure 1a, the case dynamics of influenza in France over the period 1997–2008 are shown in black. Cases attributed to influenza B are shown in red. (b) The phylogeny of influenza B's HA from isolates spanning the years 1973–2008. Sequences were randomly sampled from the influenza virus resource database. (c) Epidemiological submodel simulations of influenza B case dynamics under a model of both punctuated and gradual antigenic change. Antigenic clusters are colour-coded. (d) Proportion of cases shown in (c) belonging to each antigenic cluster. Parameters used: N = 300 million, R0 = 2, μ = 1/70 yr−1, ν = 1/7 d−1, γ = 1/15 yr−1, ɛ = 0.25, θ = 0.80, r = 0.005 and Weibull parameters k = 2, λ = 700. (e) Phylogeny of 600 simulated HA sequences, of length l = 1041 nucleotides and spanning 30 years. The GTR + I + Γ parameters were set to those estimated from the influenza B phylogeny shown in (b). These were: (πA, πC, πG, πT) = (0.35, 0.20, 0.20, 0.25), transition rates: AC = 1.42, AG = 6.15, AT = 0.54, CG = 1.03, CT = 7.19, GT = 1, gamma distribution parameter α = 0.79 and proportion of invariant sites f0 = 0.26. Other parameters for the molecular evolution submodel were mnuc = 2.85 × 10⁻³ mutations per nucleotide site per year and f = 0.01.

