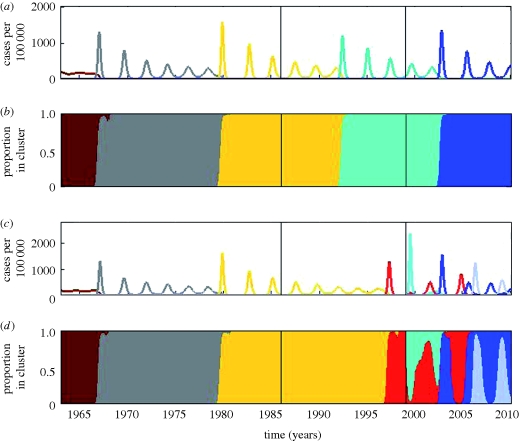
Figure 8.
Simulated epidemiological dynamics of influenza A (H3N8) in equine host across North America and Europe. (a) Simulated case dynamics in North America. Antigenic clusters are colour-coded. (b) Proportion of cases in North America belonging to each antigenic cluster. (c) Simulated case dynamics in Europe. Antigenic clusters are colour-coded. (d) Proportion of cases in Europe belonging to each antigenic cluster. The black line in 1986 marks the establishment of quarantine. The black line in 1999 marks the breakdown of quarantine for horses transported from North America to Europe. Parameters used: population sizes NNA = 9 500 000 and NE = 4 500 000 (http://www.horsetalk.co.nz/archives/2007/09/105.shtml), R0 = 2, μ = 1/20 yr−1, ν = 1/7 d−1, γ = 8 yr−1, ɛ = 0, θ = 0.6 and Weibull parameters k = 2, λ = 900. Prior to 1986, rE→NA = rNA→E = 0.01. Between 1986 and 1999, rE→NA = rNA→E = 0. After 1999, rNA→E = 0.01 and rE→NA = 0.

