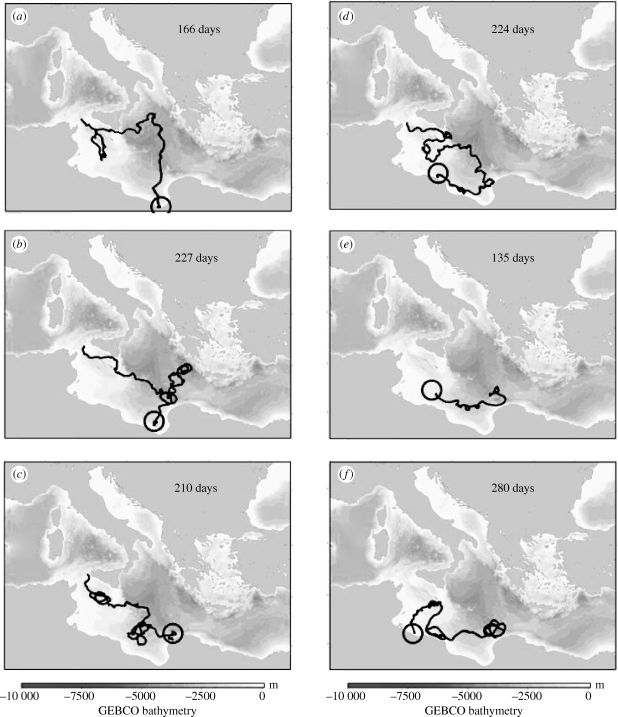
Figure 4.
Trajectories of satellite-tracked drifters. Circles indicate endpoint of each trajectory. The duration of each track is indicated in each panel. Buoys are selected to indicate possible drift scenarios from Zakynthos to Tunisia and eastern Libya. Panels (a–c) show buoy drift to North Africa from points in the central Mediterranean attained by particles within 180 days of leaving Zakynthos. Panels (d–f) indicate how the drift to North Africa might then continue with westward movement towards Tunisia.

