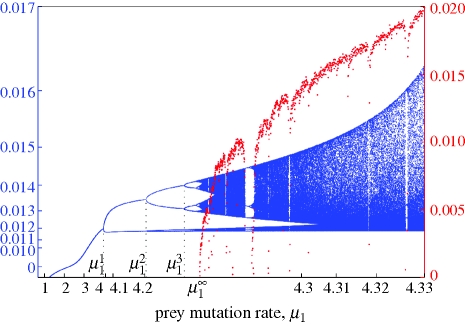
Figure 1.
Period-doubling route towards genetically driven Red Queen chaos in a three-species food chain. Peak values of the superpredator trait, x3 (blue), in the corresponding evolutionary attractor and the largest Lyapunov exponent, L1 (red), as functions of the prey mutation rate, μ1. The value  indicates the lower limit of the chaotic range. Parameter values: μ2 = 1, μ3 = 1,
  ,
,  ,
,  , r = 0.5, d2 = 0.05, d3 = 0.02, e2 = 0.14, e3 = 0.14, a21 = 0.22, a22 = 0.25, a23 = 0.6, a24 = 0, a25 = 0.04, a31 = 0.22, a32 = 0.25, a33 = 0.6, a34 = 0, a35 =− 0.04, c0 = 0.5, c1 = 0, c2 = 3.

