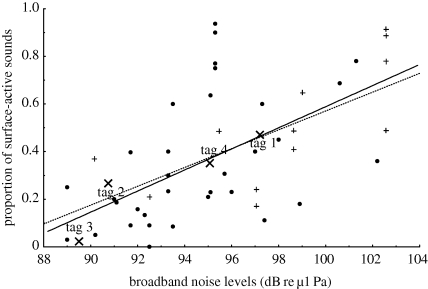
Figure 4.
Graph showing a significant positive relationship between broadband (40–2000 Hz) noise levels (dB re µ1 Pa) and the (untransformed) proportion of surface-active behaviours (dotted line and circles) in the social sound budget for all analysed groups of animals and proportion of breaching (solid line and plus signs) (singletons only). Tagged animals are demarcated by crosses.

