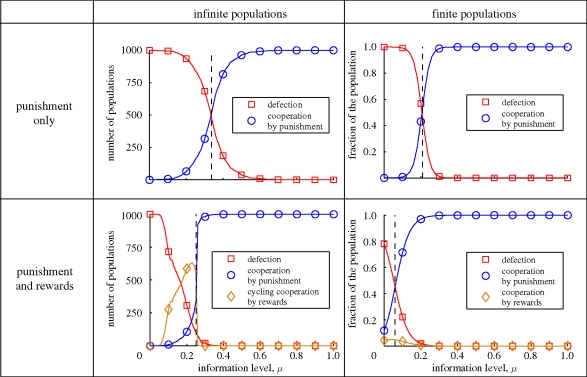
Figure 3.
Strategy selection in finite and infinite populations, depending on the information parameter μ. The left column shows the outcome of a simulation of the replicator equation for 1000 randomly chosen initial populations. If only punishment is available to sway opportunistic behaviour, then cooperative outcomes become more likely if μ exceeds roughly 1/3 (in which case [OC, P] becomes fixed). As soon as rewards are also allowed, punishment-enforced cooperation becomes predominant as soon as μ > γ/2b = 1/4. Additionally, for smaller values of μ, the population may tend to cycle between the strategies [OC, R], [OC, N], [OD, N] and [OD, R], represented by the orange line in the lower left graph. The right column shows the stationary distribution of strategies in a finite population. Again, without rewards a considerably higher information level μ is necessary to promote punishment-enforced cooperation (either [OC, P] or [OD, P]; note that both opportunist strategies become indistinguishable in the limit case of complete information). In finite populations, rewarding strategies act merely as a catalyst for the emergence of punishment; even for small μ, the outcomes [OC, R] (resp. [OD, R]) never prevail. Parameter values: b = 4, c = 1, β = γ = 2. For finite populations, the population size is M = 100 and the selection strength s = 1/10.

