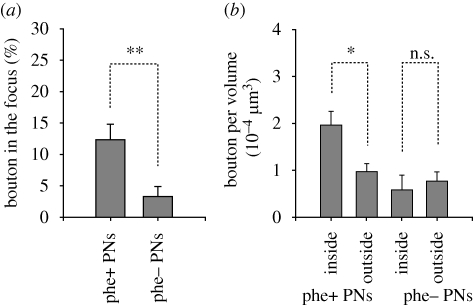
Figure 4.
Distributions of terminal boutons of PNs in the putative pheromone focus and the rest of the l ho. (a) The percentage of the number of boutons in the putative pheromone focus was significantly greater for pheromone-sensitive PNs (n = 11) than that for pheromone-insensitive PNs (n = 14; p = 0.005, t-test). (b) The bouton density in the putative pheromone focus (inside) was significantly higher than that in the rest of the l ho (outside) in the case of pheromone-sensitive PNs (left, p = 0.01, n = 11, paired t-test), but not in the case of pheromone-insensitive PNs (right, p = 0.68, n = 14, paired t-test). phe+, pheromone-sensitive PNs; phe−, pheromone-insensitive PNs. s.e.m. as error bars. n.s.: non-significant, *p < 0.05, **p < 0.01.

