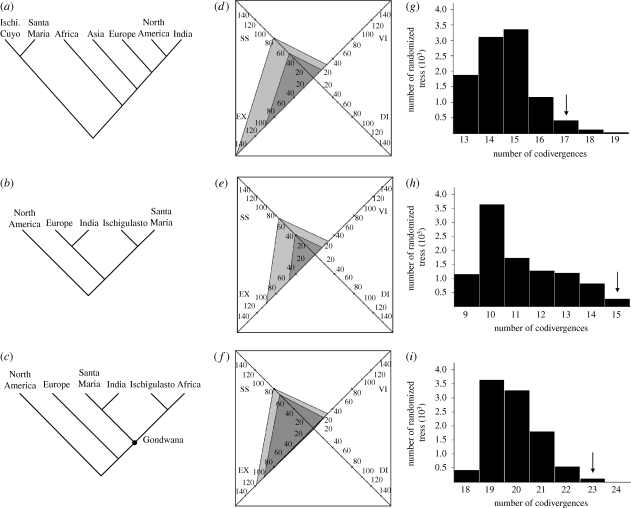
Figure 2.
Recovered cladograms of optimized geographical areas (left), events reconstructed by the TRA (center) and histograms depicting the frequency of the randomized trees (right) for the (a) Middle Triassic, (b) Ischigualastian and (c) Coloradian time slices. In the events reconstructed by the TRA (center) the dark grey areas represent the actual number of recovered events and the light green areas the ratio of biogeographical/cladogenetic events multiplied by 100. The arrows in the histograms represent the number of codivergences recovered for this time slice. Abbreviations: DI, ‘dispersals’ (taxon shift, probably owing to sampling bias in the fossil record); EX, extinctions; Ischi, Ischigualasto; SS, sympatric splits; VI, vicariances.

