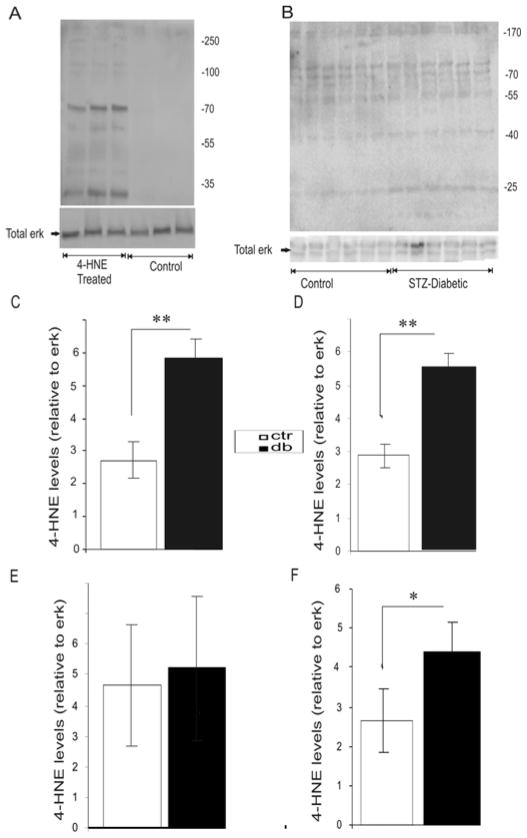
FIGURE 4.
4-HNE adduct formation in cultures of adult DRG and in DRG mitochondrial preparations from STZ-diabetic rats. (A) Western blot showing protein adducts formation in cultured neurons using anti-HNE antibody. Neurons were grown in defined F12 media supplemented with modified N2 additives and neurotrophic factors (NTFs; 1nM insulin, 1ng/ml NGF, 10ng/ml GDNF and 10ng/ml NT-3) and treated with 3.0 μM 4-HNE for 24 hr. (B) Western blot showing protein adducts formation in mitochondria from DRG of normal or STZ-diabetic rats. Mitochondria were isolated from DRG of adult STZ-diabetic and normal rats using mitochondria isolation buffer containing: 10mM HEPES (pH 7.4), 200 mM mannitol, 70mM sucrose, and 1mM EGTA. (C), (D) and (E) are the quantifications of the levels of protein adducts relative to total ERK on blot (B) at 25KDa, 40KDa and 170KDa respectively. (F) is a quantification of total levels of protein adducts on blot (B) in normal and STZ-diabetic DRG mitochondria. The band intensities from all the discernable bands on blot (B) were pooled together to generate Figure 4F. Values are means ± SEM, n = 6 replicates. * p < 0.05, ** p < 0.001.

