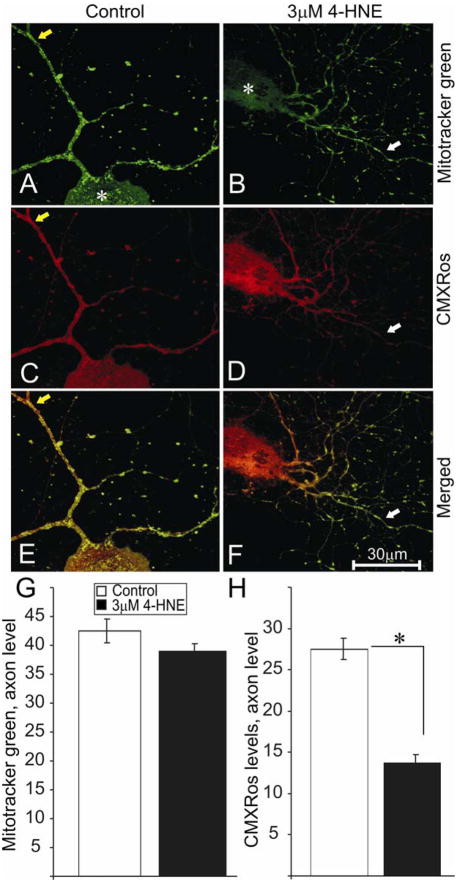
FIGURE 6.
Reduction in levels of active mitochondria in the axons of 4-HNE treated adult rat DRG neurons. (A) and (B) are stained for total mitochondria using Mitotracker green dye. (C) and (D) are stained for active mitochondria (red) using CMXRos. Neurons were grown in defined F12 media supplemented with N2 additives and neurotrophic factors and treated with 3.0 μM 4-HNE. Note: neurons were treated with 4-HNE for 24 hr following 24 hr of neuronal culture. (E) and (F) are merged images. (G) and (F) are the quantification of total and active mitochondria level in the axons respectively. White arrows indicate area of relative loss of active mitochondria. The asterisk shows cell body of neurons. Values are means ±SEM, n=48 axons. * p < 0.01.

