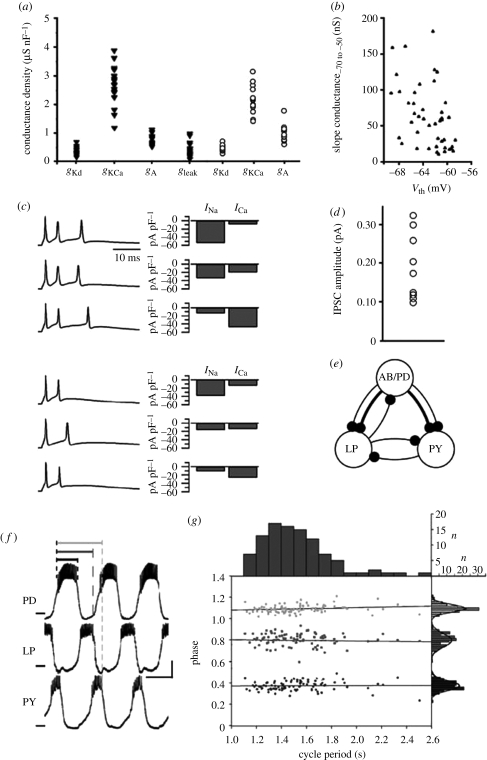
Figure 1.
(a–d) Network parameters and (f,g) output measures are variable. (a) Conductance densities of ionic membrane currents in crab inferior cardiac (triangles) and pyloric dilator neurons (circles). Each data point represents one animal. Adapted from Golowasch et al. (1999) and Goldman et al. (2000). (b) Conductance amplitude and activation threshold variability of a potassium current in guinea pig ventral cochlear nucleus neurons. Slope conductance, defined as the slope of the current–voltage relationship between −70 and −50 mV, is used as a measure of conductance amplitude. Adapted from Rothman & Manis (2003). (c) Action potential bursts and current amplitudes in mouse Purkinje neurons show variable current amplitudes in neurons with similar electrical activity. Adapted from Swensen & Bean (2005). (d) Variability in inhibitory post-synaptic current (IPSC) amplitude at a synapse between identified leech heart interneurons. Each data point represents one animal. Adapted from Marder & Goaillard (2006). (e) Simplified schematic of the crustacean pyloric pattern-generating circuit. AB/PD, anterior burster and pyloric dilator pacemaker kernel; LP, lateral pyloric neuron; PY, pyloric constrictor neuron. Thin lines, fast glutamatergic; thick lines, slow cholinergic. (f) Voltage traces of PD, LP and PY neurons in the pyloric motor pattern. Scale bars, 1 s and 10 mV. Definition of intervals PDon-PDoff (black), PDon-LPoff (dark grey) and PDon-PYoff (light grey) are indicated. (e,f) Adapted from Prinz Bucher et al. (2004). (g) Distributions of cycle period and PDon-PDoff, PDon-LPoff and PDon-PYoff phases in 99 lobster pyloric circuits. Phases are defined as interval duration divided by cycle period. Grey scale assignments are as in (f). Adapted from Bucher et al. (2005).

