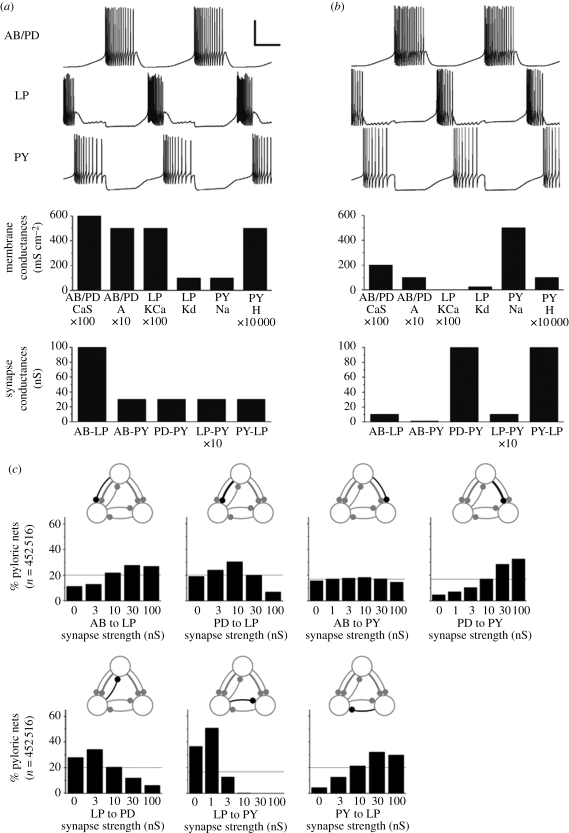
Figure 3.
Parameter variability in model solution spaces. (a,b) Electrical activity (top) and cellular and synaptic parameters (bottom) of two pyloric network models that generate similar and functional activity on the basis of widely different parameters. (c) Distributions of the pyloric network model's solution space over the strengths of the synapses in the circuit. Adapted from Prinz et al. (2004).

