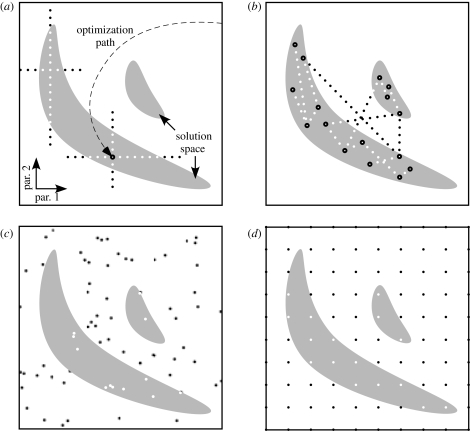
Figure 4.
Mapping solution spaces. White boxes: schematic representation of parameter space. Grey areas: solution regions. Dots: simulated parameter sets identified as solutions (white) or non-solutions (black) or found as solutions through optimization methods (white centre, black surround). (a) How sensitively model behaviour depends on model parameters can be explored by varying one parameter at a time, starting from a known solution, for example, one identified by an optimization method. (b) After running evolutionary algorithms several times with different results, solution space can be mapped by exploring hyperplanes spanned by subsets of results (lines in this two-dimensional schematic). (c) Stochastic parameter space exploration. (d) Systematic parameter space exploration on a grid. Adapted from Calabrese & Prinz (2009).

