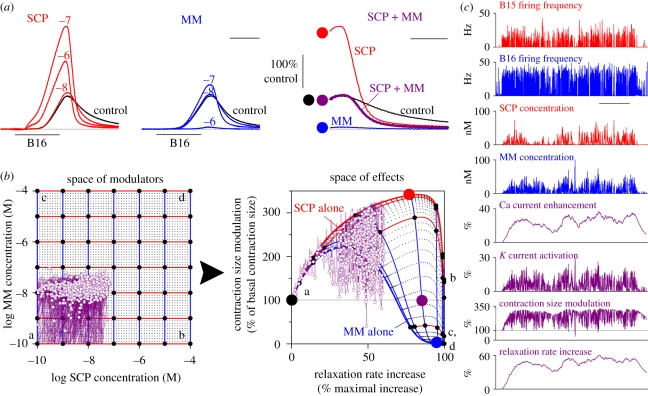
Figure 3.
Analysis of the actions of modulator combinations in the Aplysia ARC muscle system. This partial analysis considers the combinatorial action of just two modulators, SCP released from motor neuron B15 and MM released from motor neuron B16, through the subnetwork of actions shown in red in figure 2a, on just two parameters, the size and the relaxation rate, of the ARC muscle contractions. (a) Representative ARC muscle contraction shapes, recorded as in figure 2b, produced by various exogenously applied steady concentrations of SCP alone (red), MM alone (blue) and both SCP and MM applied together (purple; the peak and relaxation phase of just one contraction is shown; scale bar 1 s, 500 ms). (b) Mapping from the space of all combinations of SCP and MM concentrations (over the range from 10−10 to 10−4 M) to the space of all combinations of the effects on contraction size and relaxation rate. The grid of small dots in the two spaces shows the steady-state mapping generated by the computational model of Brezina et al. (1996, 2003a). The larger black dots and blue and red curves show how the steady-state mapping is traversed as the SCP concentration varies in the presence of constant MM concentration (red curves) or the converse (blue curves); the letters ‘a’–‘d’ identify the mapping of the four corners of the modulator space for orientation. The large black, red, blue and purple dots mark the approximate locations of the contraction shapes in (a), right. The purple overlay then shows the dynamical trajectory through the modulator and effect spaces of the entire meal modelled in (c), in the modulator space plotting against each other the SCP and MM concentration waveforms shown in (c) and in the effect space the contraction size and relaxation rate waveforms, plotting either the entire continuous waveforms (thin purple curve) or just their values at the end of the retraction phase of each feeding cycle (small purple circles). (c) Modelled waveforms of the principal variables during an entire meal eaten by a real Aplysia in vivo, comprising 749 feeding cycles over approximately 2.5 h, during which the firing frequencies of the motorneurons B15 and B16 (top two waveforms) were recorded with chronically implanted electrodes by Horn et al. (2004) and were then used by Brezina et al. (2005) to drive the computational model of Brezina et al. (2003a). Scale bar, 30 min. (a,b) modified from Brezina et al. (2003a) and (c) from Brezina et al. (2005).

