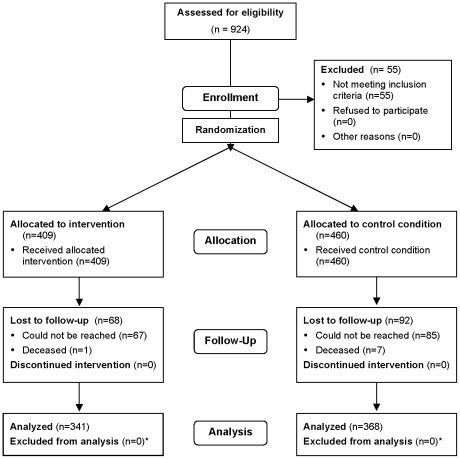
Figure 1. CONSORT flow chart.
* All participants who completed follow-up were analyzed for STI incidence. Some participants were lacking follow-up sexual risk data. See Table 2, p. 2054, in Patterson et al. (2008), Am J Public Health 98: 2051–2057 for details.

