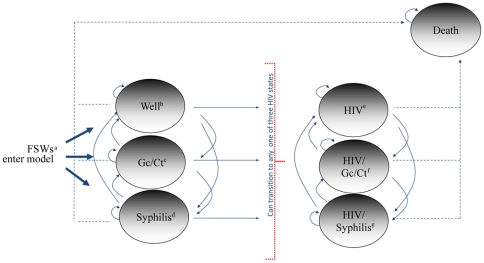
Figure 2. Schematic representation of the Markov model used for the cost effectiveness analysis for the Mujer Segura intervention.
a = Female sex workers; b = No HIV or sexually transmitted infections; c = Gonorrhea or Chlamydia trachomatis infection; d = Syphilis infection; e = HIV infection (no other sexually transmitted infections); f = HIV and gonorrhea or Chlamydia co-infection; g = HIV and syphilis co-infection.

