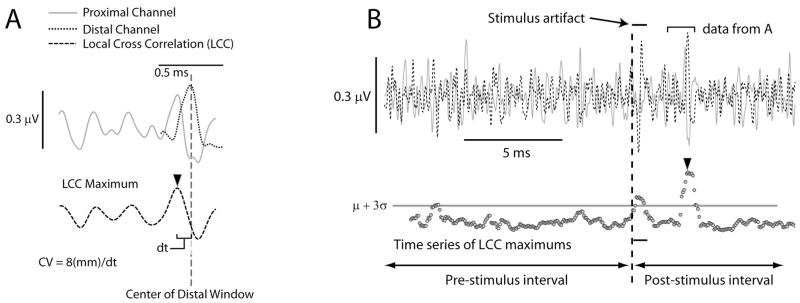
Figure 2.
Illustration of the method used to determine the first significant response in the averaged ENG recordings. (A) Example of a LCC. Data not within the appropriate local windows (see text) have been zeroed. The maximum value of the cross-correlation (arrow) is used later for determining significant responses. (B) The process was repeated for the entire sweep with the distal window shifting in 50 μs increments. Shown in the lower portion of this panel are the maximum values from the LCCs. LCC values in the pre-stimulus interval were used to calculate the mean and standard deviation of the signal.

