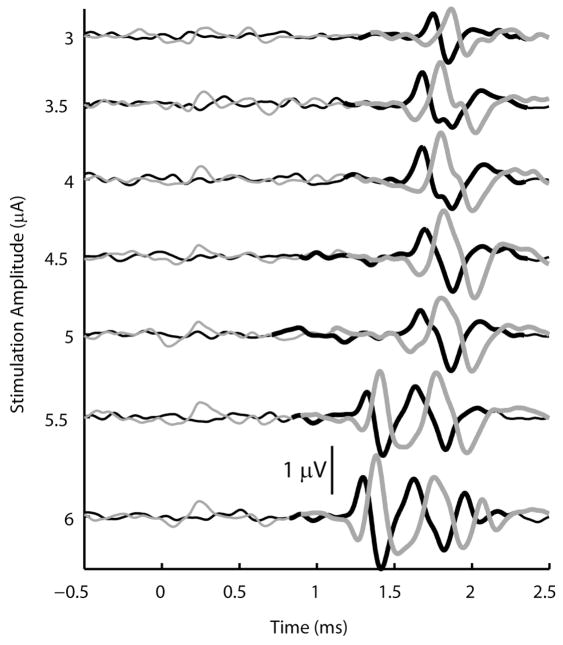
Figure 4.
Example of slow fiber recruitment prior to the recruitment of faster fibers at a higher stimulation amplitude. The CV measured at threshold was 63 m/s, and the CV of the secondary response, which first appeared at a stimulus amplitude of 5.5 μA, was 83 m/s. The signal from the proximal nerve cuff electrode is shown in black and the signal from the distal electrode is shown in gray. Thick lines indicate portions of the signal where the response was found to be significant.

