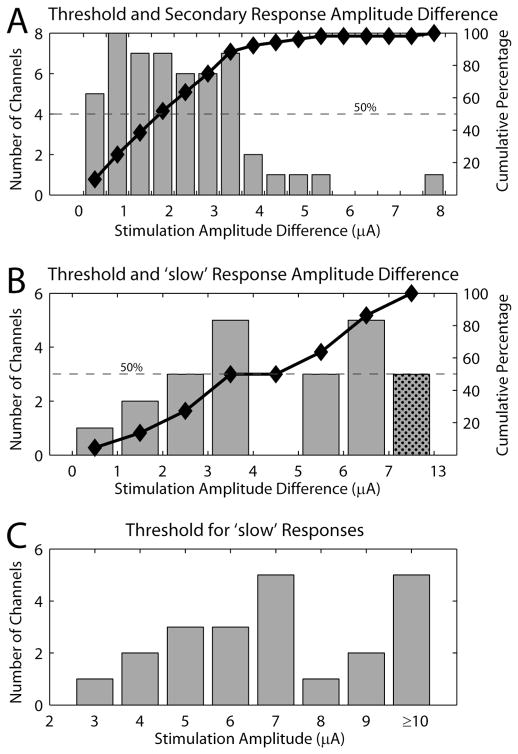
Figure 5.
Difference in stimulation amplitudes between different classes of responses. (A) Histogram of the difference in stimulus intensity at threshold and the stimulus intensity required to recruit a secondary response identified by activity at a different CV. The cumulative percentage of the distribution is plotted by the black line and markers. 100% is calculated based on the 52 electrodes that exhibited a secondary response at higher stimulus amplitudes. (B) Histogram of the difference in stimulus intensity at threshold and the stimulus intensity required to recruit a response with a CV less than 30 m/s. The smallest difference was 0.5 μA (n = 1). Significant responses with CVs less than 30 m/s were found on 22 of the 51 electrodes considered. The black line and markers show the cumulative percentage of the histogram. (C) Histogram of the stimulus amplitude required to elicit significant responses at latencies appropriate for a CV of less than 30 m/s. 25 channels in which a response was detected showed no response from ‘slow’ fibers even at the maximum possible threshold stimulus amplitude (15 channels at 9 μA and 10 channels at 10 μA).

