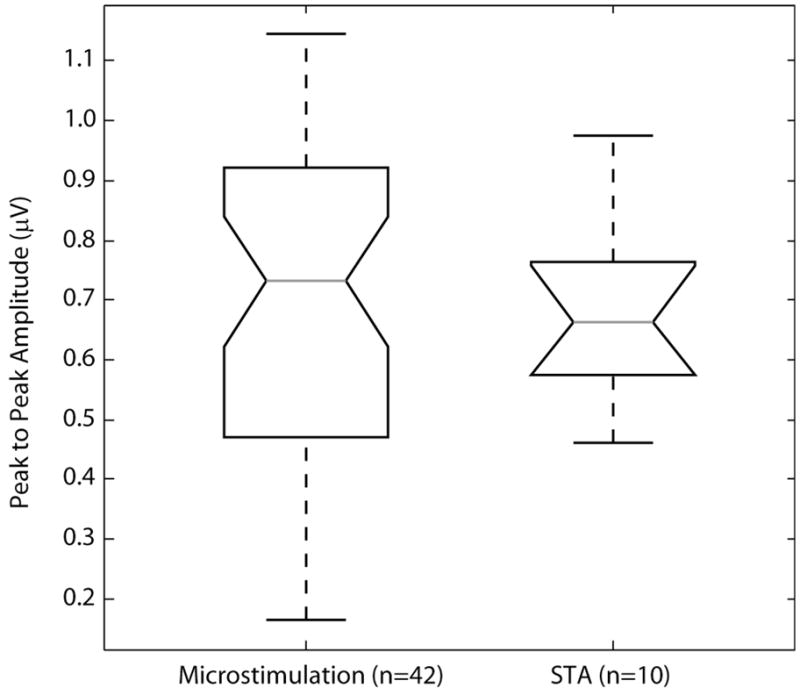
Figure 6.

Peak-to-peak response amplitudes for microstimulation trials at threshold and spike-triggered average trials in the two cats (#3 and #4) in which spike-triggered averaging trials were performed. In both cases, the mean of the proximal and distal channel were used to calculate the peak-to-peak amplitude. In cases where multiple responses were observed at the microstimulation threshold, the largest amplitude was used (n = 8 of 42 cases). The average peak-to-peak responses in the microstimulation trials and spike-triggered average trials were 0.69 ± 0.28 μV and 0.68 ± 0.16 μV respectively. No significant difference between these two groups was found (p = 0.72, Wilcoxon rank sum test). The number of trials contributing to the box plot are indicated in the abscissa labels.
