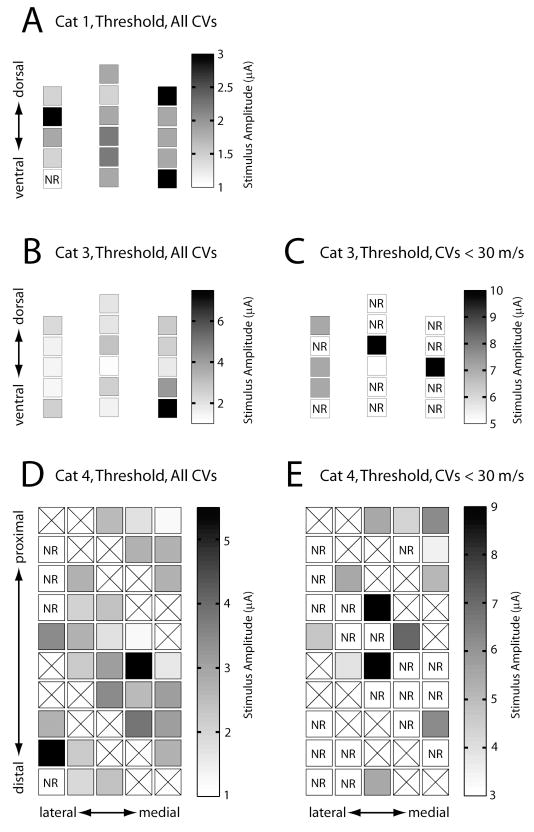
Figure 7.
Stimulus amplitude plotted by electrode location within the DRG for the threshold response in cats #1, #3, and #4 (parts A, B, and D respectively) and for the first response with a CV of less than 30 m/s in cats #3 and #4 (parts C and E respectively). Data from cat #2 was not included because only five electrodes were tested. The orientations of the electrodes within the DRG are indicated in each panel. Note that the scale bars are different for each panel. The highest thresholds shown in panel B were observed in the lower right region of the array (4.8 μA and 7.5 μA). It is possible that these electrodes were at or near the edge of the DRG perhaps accounting for their high thresholds. In addition, four electrodes on the lateral edge of the array shown in panel D did not evoke a response up to the maximum tested stimulus amplitude of 10 μA. An additional electrode on this edge had a threshold greater than 5 μA. Boxes marked with an ‘X’ indicate electrodes that were not tested. Boxes marked by ‘NR’ indicate electrodes that did not elicit a response up to the maximum tested stimulus amplitude.

