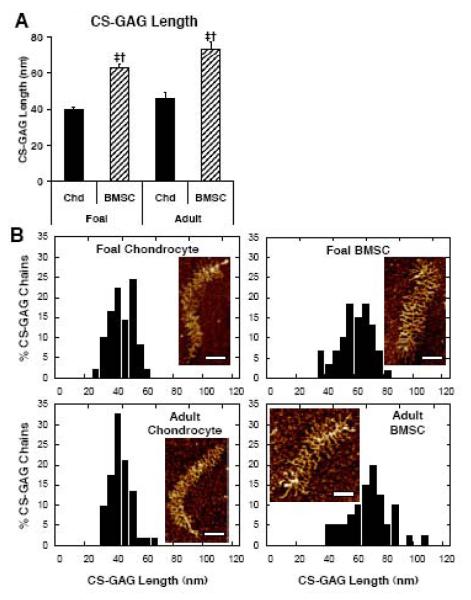
Figure 8.
Aggrecan CS-GAG Chain Quantificaiton. Aggrecan extracted from chondrocyte (Chd) and BMSC seeded peptide hydrogels after 21 days of culture with TGF-β1. (A) Average CS-GAG length per molecule. Stats: mean ± sem; n=28-35 aggrecan molecules; ‡ vs. foal chondrocyte; † vs. adult chondrocyte; p<0.05. (B) Histograms of CS-GAG distribution on the single pictured molecule. Scale bar = 100 nm.

