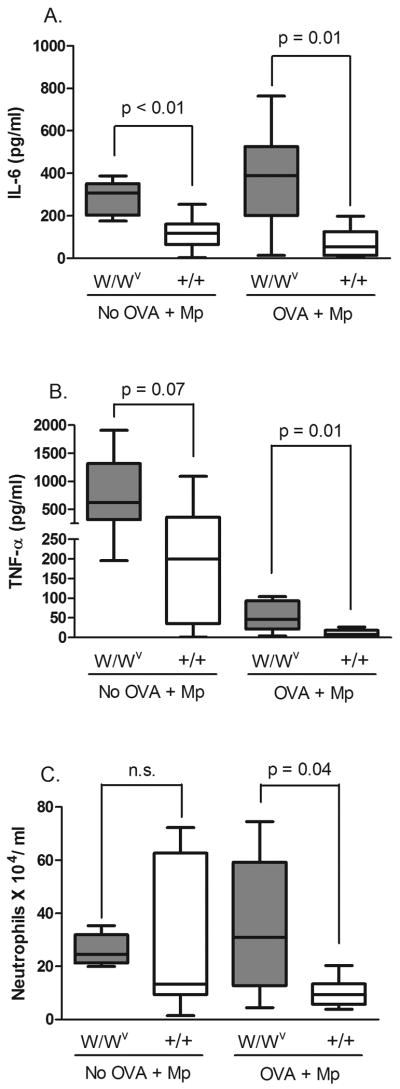
Fig. 4.
Quantification of cytokine levels and neutrophils in the BAL fluid of OVA-naïve and OVA-challenged W/Wv and wild type mice 24 hours after Mp infection. (A) IL-6 levels were increased in infected W/Wv mice compared to control littermates in both OVA-naïve and OVA-challenged mice. (B) TNF-α levels were increased in W/Wv mice compared to controls. (C) The total number of neutrophils was slightly increased in infected and OVA-challenged W/Wv mice compared to littermate controls. n = 6-8 mice per group. The data are presented in box and whisker plots with the 75th and 25th quartiles and the max and min indicated by box and whiskers respectively. The bar represents the median. P values were determined using the Mann-Whitney U test.

