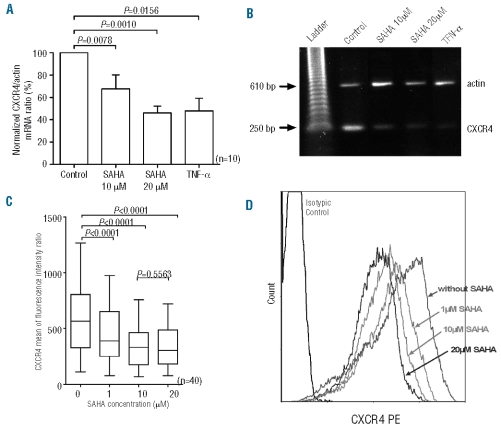
Figure 3.
SAHA-induced down-regulation of CXCR4 mRNA and protein. (A) After treatment for 24 h with various concentrations of SAHA, RNA was isolated and subjected to reverse transcriptase PCR analysis. The results are expressed as mean ratios of CXCR4/β-actin for the ten CLL patients evaluated. (B) Electrophoresis of one representative sample. (C) Cells were cultured in medium alone or with SAHA and stained with anti-CD19 and anti-CXCR4-phycoer ythrin. Results are expressed a mean of fluorescence intensity ratio (MFIR). (D) Representative flow cytometric analysis of surface CXCR4 protein on untreated or SAHA-treated CD19 positive cells.

