Abstract
Freshwater resources are fundamental for maintaining human health, agricultural production, economic activity as well as critical ecosystem functions. As populations and economies grow, new constraints on water resources are appearing, raising questions about limits to water availability. Such resource questions are not new. The specter of “peak oil”—a peaking and then decline in oil production—has long been predicted and debated. We present here a detailed assessment and definition of three concepts of “peak water”: peak renewable water, peak nonrenewable water, and peak ecological water. These concepts can help hydrologists, water managers, policy makers, and the public understand and manage different water systems more effectively and sustainably. Peak renewable water applies where flow constraints limit total water availability over time. Peak nonrenewable water is observable in groundwater systems where production rates substantially exceed natural recharge rates and where overpumping or contamination leads to a peak of production followed by a decline, similar to more traditional peak-oil curves. Peak “ecological” water is defined as the point beyond which the total costs of ecological disruptions and damages exceed the total value provided by human use of that water. Despite uncertainties in quantifying many of these costs and benefits in consistent ways, more and more watersheds appear to have already passed the point of peak water. Applying these concepts can help shift the way freshwater resources are managed toward more productive, equitable, efficient, and sustainable use.
Keywords: surface water, water use, sustainable water management
The Earth has substantial water resources, in numerous forms and qualities, in various stocks and flows in the hydrologic cycle. Overall, the planet has a stock of approximately 1.4 billion cubic kilometers of water, the vast majority of which (nearly 97%) is salt water in the oceans. The world’s more limited freshwater stocks are estimated at around 35 million cubic kilometers. Most fresh water, however, is locked up in glaciers in Antarctica and Greenland, in permanent snow cover in mountains or high latitudes, or in deep groundwater inaccessible to humans for practical reasons. Only small fractions are readily available to humans in river flows, accessible surface lakes and groundwater, soil moisture, or rainfall (1). Table 1 shows the distribution of the main components of the world’s water.
Table 1.
Major stocks of water on Earth (34)
| Distribution area, 103 km2 | Volume, 103 km3 | Percent of total water, % | Percent of fresh water, % | |
| Total water | 510,000 | 1.386 million | 100 | — |
| Total freshwater | 149,000 | 35,000 | 2.53 | 100 |
| World oceans | 361,300 | 1.340 million | 96.5 | — |
| Saline groundwater | — | 13,000 | 1 | — |
| Fresh groundwater | — | 10,500 | 0.76 | 30 |
| Antarctic glaciers | 13,980 | 21,600 | 1.56 | 61.7 |
| Greenland glaciers | 1,800 | 2,340 | 0.17 | 6.7 |
| Arctic islands | 226 | 84 | 0.006 | 0.24 |
| Mountain glaciers | 224 | 40.6 | 0.003 | 0.12 |
| Ground ice/permafrost | 21,000 | 300 | 0.022 | 0.86 |
| Saline lakes | 822 | 85.4 | 0.006 | — |
| Freshwater lakes | 1,240 | 91 | 0.007 | 0.26 |
| Wetlands | 2,680 | 11.5 | 0.0008 | 0.03 |
| Rivers (as flows on average) | — | 2.12 | 0.0002 | 0.006 |
| In biological matter | — | 1.12 | 0.0001 | 0.0003 |
| In the atmosphere (on average) | — | 12.9 | 0.0001 | 0.04 |
Serious water challenges face humanity, including the failure to meet basic human needs for safe water and sanitation for billions, growing contamination of water with human and industrial wastes, the consequences of extreme events such as floods and droughts, ecological disruption in aquatic ecosystems, increasing concerns about water shortages and scarcity, and the growing risks from climatic changes that will affect regional hydrology and water management. Considering the total volume of water on Earth, however, the concept of “running out” of water at the global scale is of little practical utility. There are huge volumes of water—many thousands of times the volumes that humans appropriate for all purposes. In the early 2000s, total global withdrawals of water were approximately 3,700 km3 per year, a tiny fraction of the estimated stocks of fresh water (2).
A more accurate way to evaluate human uses of water, however, would look at regional stocks and flows of water and the impact of human appropriations at various scales through the use of rainfall, surface and groundwater stocks, and soil moisture. An early effort to evaluate these uses estimated that substantially more water in the form of rain and soil moisture—perhaps 11,300 km3/yr—is appropriated for human-dominated land uses such as cultivated land, landscaping, and to provide forage for grazing animals. Overall, that assessment concluded that humans already appropriate over 50% of all renewable and “accessible” freshwater flows, including a fairly large fraction of water that is used in-stream for dilution of human and industrial wastes (3). It is important to note, however, that these uses are of the “renewable” flows of water, which we explain below. In theory, the use of renewable flows can continue indefinitely without any effect on future availability. Still, although many flows of water are renewable, some uses of water will degrade the quality to a point that constrains the kinds of use possible.
In the past few years, various resource crises around water, energy, and food have led to new debates over definitions and concepts about sustainable resource management and use. Some energy experts have proposed that the world is approaching, or has even passed, the point of maximum production of petroleum, or peak oil (4–7). More recently, there has been a growing discussion of whether we are also approaching a comparable point for water resources, where natural limits will constrain growing populations and economic expansion. In this article, we define the concept of peak water and we evaluate the similarities and differences between water and oil, how relevant this idea is to actual hydrologic and water-management challenges, and the implications of limits on freshwater availability for human and ecosystem wellbeing.
Regional water scarcity is a significant and growing problem. Many possible indicators have been developed to measure water scarcity, including both single-factor and weighted water measures (8). The United Nations has offered a definition of water stress as regions where water consumption exceeds 10% of renewable freshwater resources. Other definitions set per-capita availability standards for defining scarcity (9–12). These kinds of indicators inform decision making and offer insights into progress on addressing water problems, but no single measure can completely describe the characteristics of water scarcity. Despite the lack of clear and specific measures of scarcity, it is increasingly apparent that some regions are experiencing limits to growth in water use due to natural, ecological, political, or economic constraints.
Concept of Peak Resource Production
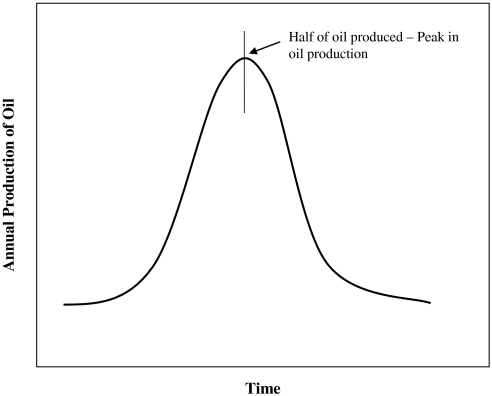
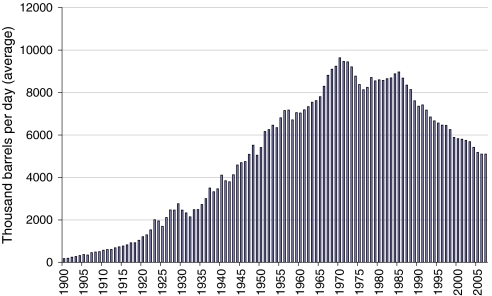
The theory of peak resource production originated in the 1950s with the work of geologist M. King Hubbert and colleagues who suggested that the rate of oil production would likely be characterized by several phases that follow a bell-shaped curve (13). The first phase is the discovery and rapid increase in growth in the rate of exploitation of oil as demand rises, production becomes more efficient, and costs fall. Second, as stocks of oil are consumed and the resource becomes increasingly depleted, costs rise and production levels off and peaks at a point now known as peak oil. Finally, increasing scarcity and costs lead to a decline in the rate of production more quickly than new supplies can be found or produced. This last phase would also be typically accompanied by the substitution of alternatives. The phrase peak oil refers to the point at which approximately half of the existing stock of petroleum has been depleted and the rate of production peaks (see Fig. 1). In a now-classic paper, Hubbert (1956) predicted that oil production in the United States would peak between 1965 and 1970 (13). In 1970, oil production in the United States reached a maximum and began to decline (Fig. 2). The concept of a roughly bell-shaped oil production curve has been proven for a well, an oil field, a region, and is thought to hold true worldwide.
Fig. 1.
There is no reason actual peak resource curves have to follow symmetrical bell curves.
Fig. 2.
Total annual US production of crude oil, 1900–2007. US production peaked in 1970 (14, 33).
In recent years, the concept of peak oil has received renewed attention because of growing concern that the world as a whole is approaching the point of declining petroleum production. No one knows when global oil production will actually peak, and forecasts of the date range from early in the 21st century to after 2025. One of many recent estimates suggests that oil production may peak as early as 2012 at 100 million barrels of oil per day (15). The actual peak of production will only be identified in hindsight, and its timing depends on the demand and cost of oil, the economics of technologies for extracting oil, the rate of discovery of new reserves compared to the rate of extraction, the cost of alternative energy sources, and political factors.
Comparison of Peak Production in Oil and Water
Does production or use of water follow a similar bell-shaped curve? In the growing concern about global and local water shortages and scarcity, is the concept of peak water valid and useful to hydrologists, water planners, managers, and users? In the following sections, we consider the differences and similarities between oil and water to evaluate whether a peak in the production of water is possible, and in what contexts it may be relevant.
Key Characteristics of Renewable and Nonrenewable Resources.
In any comparison among resources, it is vital to distinguish between renewable and nonrenewable resources. The key difference between these is that renewable resources are flow or rate limited; nonrenewable resources are stock limited (16). Stock-limited resources, especially fossil fuels, can be depleted without being replenished on a timescale of practical interest. Stocks of oil, for example, accumulated over millions of years; the volume of oil stocks is thus effectively independent of any natural rates of replenishment because such rates are so slow. Conversely, renewable resources, such as solar energy, are virtually inexhaustible over time, because their use does not diminish the production of the next unit. Such resources are, however, limited by the flow rate, i.e., the amount available per unit time. Our use of solar energy has no effect on the next amount produced by the sun, but our ability to capture solar energy is limited to the rate at which it is delivered.
Water demonstrates characteristics of both renewable and nonrenewable resources. This dual characteristic of water has implications for the applicability of the term peak water. Water is largely a renewable resource with rapid flows from one stock and form to another, and the human use of water typically has no effect on natural recharge rates. But there are also fixed or isolated stocks of local water resources that are being consumed at rates far faster than natural rates of renewal. Most of these nonrenewable resources are groundwater aquifers—often called “fossil” aquifers because of their slow-recharge rates. Tiwari et al. (17) recently calculated that a substantial fraction of water used in India comes from nonrenewable groundwater withdrawals, and that water ends up in the oceans, incrementally raising sea levels, but substantially depleting groundwater stocks. Syed et al. (18) found similar transfers of nonrenewable groundwater for a wide variety of groundwater basins using new data from the GRACE satellite. Some surface water storage in the form of lakes or glaciers can also be used in a nonrenewable way where consumption rates exceed natural renewal, a problem that may be worsened by climate change, as noted below.
Consumptive vs. Nonconsumptive Uses.
Another key factor in evaluating the utility of the concept of a resource peak is whether resource use is “consumptive” or “nonconsumptive.” Practically every use of petroleum is consumptive; once the energy is extracted and used, it is degraded in quality.* Almost every year, the amount of oil consumed matches the amount of oil produced, and sometimes we consume more than is produced that year. Thus a production curve for oil is solely dependent on access to new oil.
Not all uses of water are consumptive and even water that has been “consumed” is not lost to the hydrologic cycle or to future use—it is recycled by natural systems. Consumptive use of water typically refers to uses that make that water unavailable for immediate or short-term reuse within the same watershed. Such consumptive uses include water that has been evaporated, transpired, incorporated into products or crops, heavily contaminated, or consumed by humans or animals. As discussed in the section on the renewability of water resources, some stocks of water can be consumed locally, making them, effectively, nonrenewable resources. When withdrawals are not replaced on a timescale of interest to society, eventually that stock becomes depleted. The water itself remains in the hydrologic cycle, in another stock or flow, but it is no longer available for use in the region originally found. There are also many nonconsumptive uses of water, including water used for cooling in industrial and energy production, and water used for washing, flushing, or other residential uses if that water can be collected, treated, and reused. This water recycles into the overall hydrological cycle and has no effect on subsequent water availability in a region.
Substitutability.
Another important characteristic of peak resource discussions is the potential to substitute alternatives for nonrenewable sources. As oil production declines and prices increase, substitutes that offer the same benefits become increasingly attractive. Oil serves particular functions in industrial society that can be satisfied by other means or resources (solar, natural gas, biofuels, etc.). In this sense, any depletable resource such as fossil fuels must be considered a transition option, useful only as long as its availability falls within economic and environmental limits. Like energy, water is used for a wide variety of purposes. And like energy, the efficiency of water use can be greatly improved by changes in technologies and processes. Unlike oil, however, fresh water is the only substance capable of meeting certain needs. Thus, although other energy sources can substitute for oil, water has no substitutes for most uses.
When limits to water availability in a given region are reached, there are a few possible options to meet additional needs: reducing demand, substituting one use of water for another that has higher economic or social value, physically moving the demand for water to a region where additional water is available; or investing in a higher priced source of supply, including bulk imports or transfers of water. In this case, the cost of new supply, including the cost of transporting water, is a limiting factor.
A relevant concept to both peak water and peak oil, therefore, is the introduction of a “backstop” technology when the price of the resource rises, a concept given prominence by Nordhaus (19). As oil production peaks and then declines, the price of oil will rise in the classic “supply/demand” economic response. Prices will continue to rise until the point when a substitute, or backstop, for oil becomes economically competitive, at which point prices will stabilize at the new backstop price. Nordhaus (19) noted that a backstop alternative is one capable of meeting the demand and that has a virtually infinite resource base.
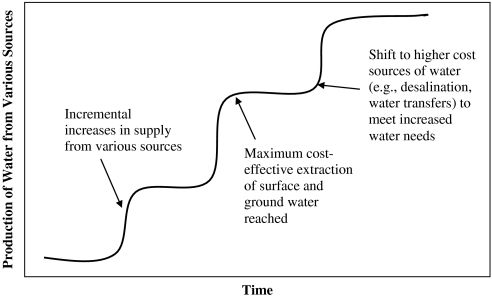
Similarly, for water, as cheaper sources of water are depleted or allocated, more and more expensive sources must be found and brought to the user, either from new supplies or reallocation of water among existing users. Fig. 3 graphs a potential water-production scenario in a watershed, where incremental supply increases through supply side projects, e.g., groundwater harvesting, in-stream flow allocation, and reservoir construction are layered upon each other until the maximum cost-effective extraction of surface and groundwater is reached.
Fig. 3.
A potential water-production (supply) scenario in a watershed or region. As demand increases, incremental supply projects (new dams, reservoirs, pumping) increase water availability. Once the maximum cost-effective extraction of surface and groundwater is reached, there is a final shift to a higher cost backstop supply of water such as desalination or water transfers.
Ultimately, the backstop price for water will also be reached. Unlike oil, however, which must be backstopped by a different, renewable energy source, the ultimate water backstop is still water, from an essentially unlimited source—for example, desalination of ocean water. The amount of water in the oceans that humans can use is limited only by how much we are willing to pay to remove salts and transport it to the point of use, and by the environmental constraints of using it. In some regions, desalination is already an economically competitive alternative, particularly where water is scarce compared to demand, such as certain islands in the Caribbean and parts of the Persian Gulf (20, 21).
Transportability.
The concept of running out of water at the global scale is of little practical use. Huge volumes of water over and above the volumes used by humans for all purposes are distributed around the world in various stocks. Because the Earth will never “run out” of fresh water, concerns about water scarcity must, therefore, be the result of something other than a fear that we are literally consuming a limited resource. And, of course, they are: Water challenges are the result of the tremendously uneven geographic distribution of water (due to both natural and human factors), the economic and physical constraints on tapping some of the largest volumes of freshwater (such as deep groundwater and ice in Antarctica and Greenland), human contamination of some readily available stocks, and the high costs of moving water from one place to another.
This last point—the “transportability” of water—is particularly relevant to the concept of peak water. Oil is transported around the world because it has a high economic value compared to the cost of transportation. For example, one of today’s supertankers carries as much as 3.6 million barrels of oil. At a price of $70 per barrel, that oil is worth over $250 million dollars and the cost of transportation is minor. As a result, regional limits on oil availability can be overcome by moving oil from any point of production to any point of use. In contrast, water is very expensive to move any large distance, compared to its value. That same supertanker filled with freshwater would have an economic value of only around $500,000†—far too little to support long-distance shipping and regional constraints become a legitimate and serious concern.
As a result, media attention to the concept of peak water has focused on local water scarcity and challenges, for good reason. But there has been little or no academic research or analysis on this concept. In regions where water is scarce, the apparent nature of water constraints—and hence, some of the real implications of a “peak” in availability—are already apparent. Because the costs of transporting bulk water from one place to another are so high, once a region’s water use exceeds its renewable supply, it will begin tapping into nonrenewable resources, such as slow-recharge aquifers. Once extraction of water exceeds natural rates of replenishment, the only long-term options are to reduce demand to sustainable levels, move the demand to an area where water is available, or to shift to increasingly expensive sources, such as desalination or imports of goods produced in regions with adequate water supplies, the transfer of so-called virtual water (22).
There are very few exceptions to the economic limits on transporting water. Bottled water is sometimes consumed vast distances from where it was produced only because it commands a premium far above normal costs. Growth in bottled water consumption may expand in some markets, but overall, bulk water is not currently a significant export in commercial markets because of the economic limits to transport and total volumes moved any significant distance are a tiny fraction of total urban or agricultural demands.
Three Peak Water Concepts
Table 2 summarizes the characteristics of oil and water discussed above. Given the physical and economic characteristics of resources reviewed above, how relevant or useful is the concept of a peak in the production of water? We offer here three definitions where the concept of a peak is useful in the context of water resources and we introduce a term that is useful when thinking about maximizing the multiple services that water provides: “peak ecological water.” These peak water concepts should help drive important paradigm shifts in how water is used and managed.
Table 2.
Summary comparison of oil and water
| Characteristic | Oil | Water |
| Quantity of resource | Finite | Literally finite, but practically unlimited at a cost |
| Renewable or nonrenewable | Nonrenewable resource | Renewable overall, but with locally nonrenewable stocks |
| Flow | Only as withdrawals from fixed stocks | Water cycle renews natural flows |
| Transportability | Long-distance transport is economically viable | Long-distance transport is not economically viable |
| Consumptive versus nonconsumptive use | Almost all use of petroleum is consumptive, converting high-quality fuel into lower-quality heat | Some uses of water are consumptive, but many are not; overall, water is not consumed from the hydrologic cycle |
| Substitutability | The energy provided by the combustion of oil can be provided by a wide range of alternatives | Water has no substitute for a wide range of functions and purposes |
| Future prospects | Limited availability; substitution inevitable by a backstop renewable source | Locally limited, but globally unlimited after backstop source (e.g., desalination of oceans) is economically and environmentally developed |
Peak Renewable Water.
A significant, albeit poorly quantified fraction of total human use of water comes from water taken from renewable flows of rainfall, rivers, streams, and groundwater basins that are recharged over relatively short time frames. Such systems experience stochastic hydrology, but use of water does not affect the ultimate renewability of the resource, much like solar energy use. Because a particular water source may be renewable, however, does not mean that it is unlimited. Indeed, the first peak water constraint is the limit on total water that can be withdrawn from a system. The ultimate limit is the complete renewable flow.
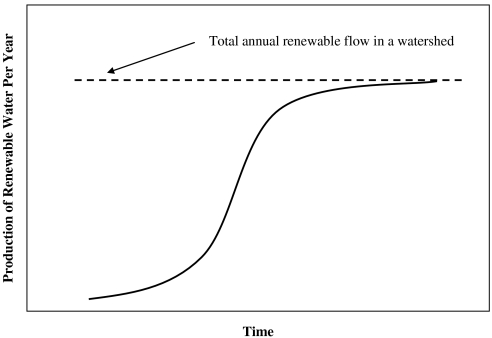
As shown in Fig. 4, when the production of renewable water from a watershed reaches 100% of renewable supply, it forms a classic logistics curve, similar to a biological carrying capacity model. Each watershed only has a certain amount of renewable water supply that is replenished every year. If the annual production of renewable water from a watershed began to increase exponentially, it approaches the natural limit of the total annual renewable supply of water (shown as a dashed line). This limit varies, of course, with natural variation in hydrology, but it is the ultimate limit in terms of appropriation of renewable water supply. The appropriate practical limit may be substantially less than this, as discussed below under Peak Ecological Water. Increasing annual renewable water use to the theoretical renewable limit has been shown to result in tremendous ecological, environmental, and human damage.
Fig. 4.
Theoretical logistics curve showing increasing annual production of renewable water from a watershed. Annual renewable water production increases exponentially and then levels off as it reaches the total annual renewable water supply in the watershed.
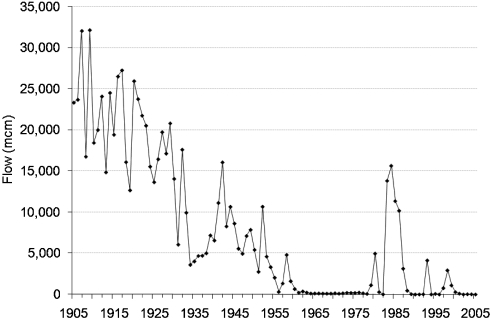
For a number of major river basins, peak renewable water limits have already been reached as human demand consumes close to the entire annual supply. The Colorado River in the United States, for example, is shared by seven US states and Mexico, and in an average year little or no water reaches the delta (see Fig. 5). For this watershed, the limit of peak renewable water is an average of around 18 billion cubic meters annually—the total average annual flow. Other rivers are increasingly reaching their peak limits as well, including the Huang He (Yellow River) in China, the Nile in Northern Africa, and the Jordan in the Middle East, where formerly perennial river flows now often fall to zero. Under other circumstances, as noted below, peak renewable water systems can sometimes be turned into nonrenewable systems through physical or chemical processes.
Fig. 5.
Annual flows (in million cubic meters) of the Colorado River into the delta from 1905 to 2005 at the Southern International Border station. Note that, in most years after 1960, flows to the delta fell to zero as total withdrawals equaled total (or peak) renewable supply. The exceptions are extremely high-flow years when runoff exceeded demands and the ability to store additional water (International Boundary Waters Commission data on Colorado River flows at the Southern International Border. Water data from http://www.ibwc.state.gov/wad/DDQSIBCO.htm).
Peak Nonrenewable Water.
In some watersheds, a substantial amount of current water use comes from stocks of water that are effectively nonrenewable, such as groundwater aquifers with very slow-recharge rates or groundwater systems that lose their ability to be recharged when overpumped due to compaction or other physical changes in the basin. When the use of water from a groundwater aquifer far exceeds the natural recharge rate, this stock of groundwater will be quickly depleted. Or when groundwater aquifers become contaminated with pollutants that make the water unusable, a renewable aquifer can become nonrenewable.
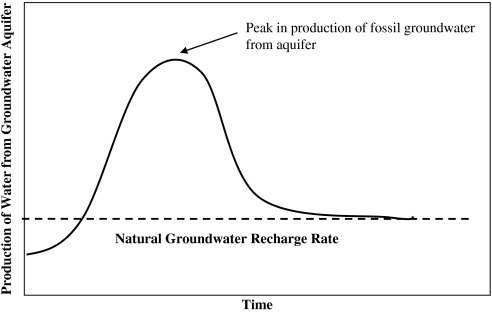
In these particular situations, the groundwater aquifer is closely analogous to an oil field or oil-producing region. Continued production of water beyond natural recharge rates will become increasingly difficult and expensive as groundwater levels drop, leading to a peak of production, followed by diminishing withdrawals and use. This kind of unsustainable groundwater use can be found in the Ogallala Aquifer in the Great Plains of the United States, the North China plains, California’s Central Valley, and numerous basins in India (23). Tiwari et al. (24) estimate that nonrenewable use of water in India averaged 54 ± 9 km3 per year between 2002 and 2008 or around 8% of India’s total water withdrawals.
As shown in Fig. 6, even when the rate of withdrawals from a groundwater aquifer passes the natural recharge rate for the aquifer (shown as a dashed line), the production of water from the aquifer can continue to increase until a significant portion of the groundwater has been harvested. After this point, deeper boreholes and increased pumping will be required to harvest the remaining amount of water, potentially reducing the rate of production of water.
Fig. 6.
This theoretical curve shows the progression of unsustainable water extraction from a groundwater aquifer, hypothesizing a peak-type production curve for water after the production rates surpass the natural groundwater recharge rate and production costs rise. Long-term sustainable withdrawals cannot exceed natural recharge rates.
It is also possible that the production of water from the aquifer will continue to increase until all the economically affordable groundwater is harvested, after which the production of water drops quickly. In both these cases, the important point is that extraction will not fall to zero, but to the renewable recharge rate where economically and physically sustainable pumping is possible.
In some places, climate change will affect the nature and magnitude of peak water. Where local communities are currently dependent on river runoff from glacier melt, the loss of glaciers in coming years will lead to a “peak nonrenewable water” effect: the diminishment of water supply over time. Communities dependent on groundwater recharge that suffer a decrease in recharge rate will also experience an effect akin to peak water. In this case, the concept of peak water is slightly different: It is not affected by the magnitude of human use, but by physical or climatic factors that diminish the rate of, or potential for, replenishment. Similar to peak oil, however, when the stock is gone, alternative sources will have to be found.
Peak Ecological Water.
For many watersheds, a more immediate and serious concern than running out of water is exceeding a point of water use that causes serious or irreversible ecological damage. Water provides many services: Not only does it sustain human life and commercial and industrial activity, but it is also fundamental for the sustenance for animals, plants, habitats, and environmentally dependent livelihoods (25, 26, 27).
Each new incremental supply project that captures water for human use and consumption decreases the availability of that source to support ecosystems and diminishes the capacity to provide services. The water that has been temporarily appropriated or moved was once sustaining habitats and terrestrial, avian, and aquatic plants and animals. By some estimates, humans already appropriate almost 50% of all renewable and accessible freshwater flows (28), leading to significant ecological disruptions. Since 1900, half of the world’s wetlands have disappeared (29). The number of freshwater species has decreased by 50% since 1970, faster than the decline of species on land or in the sea. River deltas are increasingly deprived of flows due to upstream diversions, or receive water heavily contaminated with human and industrial wastes.
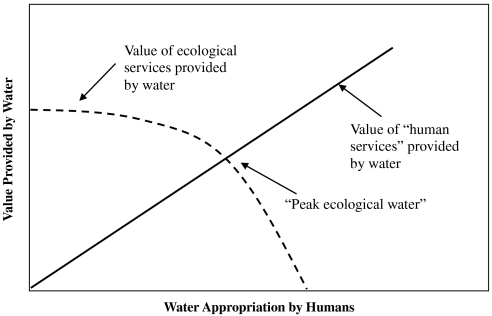
Fig. 7 is a simplified graph of the value that humans obtain from water produced through incremental increases in supply (e.g., drinking water and irrigation), plotted against the declining value of the ecological services (e.g., water for plants and animals) that were being satisfied with this water. The graph assumes that ecological services decrease as water is appropriated from watersheds (though in nature such declines may be nonlinear). The pace or severity of ecological disruptions increases as increasing amounts of water are appropriated. Because ecological services are not easily valued in dollar terms, the y axis should be considered the overall (economic and noneconomic) “value provided by water.”
Fig. 7.
This graph charts the value of water provided by increasing supply from various sources in a watershed against the loss in value of ecological services provided by that water. As water withdrawals for human needs increase (solid line), the ecological services provided by same water are in decline (dashed line). At a certain point, the value of water provided through new supply projects is equal to the value of the ecological services. Beyond this point, ecological disruptions exceed the benefits of increased water extraction. We call this point peak ecological water (see Fig. 8).
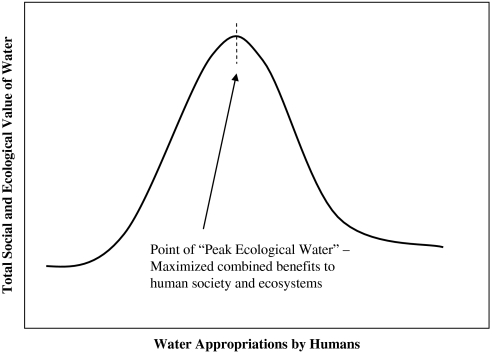
At a certain point, the value of ecological services provided by water is equivalent to the value of human services satisfied by that same use of water. After this point, increasing appropriation of water leads to ecological disruptions beyond the value that this increased water provides to humans (the slope of the decline in ecological services is greater than the slope of the increase in value to humans). We define this point to be peak ecological water—where society will maximize the total ecological and human benefits provided by water. As shown in Fig. 8, the overall value of water, combining ecological and social benefits, then declines as human appropriation increases. Economists and resource analysts have long noted the difficulty of quantifying this point because of problems in assigning appropriate valuations to each unit of water or each unit of ecosystem benefit in any watershed (30). But the mistaken assumption that such values are zero has led to them being highly discounted, underappreciated, or ignored in 20th century water policy decisions.
Fig. 8.
This graph charts the overall value of water, a combination of social, economic, and ecological value, as water appropriation by humans increases. The value increases to a peak, where benefits to society and ecosystems is maximized, but then declines as increased appropriations lead to excessive ecosystem and social costs. Nonmonetary costs and benefits are hard to quantify, but must be included to avoid exceeding the point of peak ecological water.
Peak Water in the United States
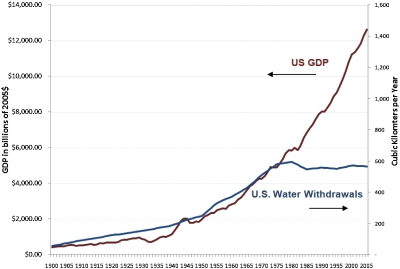
Data on total water use is sparse. Few countries or regions collect such data because of the physical or political difficulties of accurately measuring water withdrawals from countless diverse sources to meet agricultural, industrial, commercial, and domestic needs. As a result, identifying peak water limits will be difficult. Nevertheless, there is some strong evidence that the United States may have already passed the point of peak water, including peak renewable, nonrenewable, and ecological water. Fig. 9 shows US gross domestic product (in 2005 dollars) plotted with total water withdrawals in the United States, for all purposes, from 1900 to 2005, based on data from state and federal water agencies, compiled largely by the US Geological Survey’s water use assessments (31). These two curves grew exponentially, in lockstep, through the first three-quarters of the 20th century. After the late 1970s, however, the two curves split apart, and total water withdrawals in the United States are now below their maximum level. Per-capita water withdrawals have fallen even more, as population has also continued to grow. Some of the reasons for this dramatic change include improving efficiency of water use, changes in the structure of the US economy, the implementation of the Clean Water Act, which led to reductions in industrial water use and discharges, and physical, economic, and environmental constraints on access to new supplies. Some of the reasons for this change are explored in more detail elsewhere (32). But the graph suggests that the United States may well be past the point of peak water.
Fig. 9.
US gross domestic product (GDP) in 2005 dollars from 1900 to 2005 (left axis) plotted with total water withdrawals for all purposes in cubic kilometers per year (right axis). Data on GDP come from the US Bureau of Economic Analysis; data on water use comes from the US Geological Survey (31).
Whether this change is permanent or temporary is unknown. In theory, US production of oil could increase again and even exceed, for a while, the previous peak, although resource, economic, and environmental constraints make this unlikely. Similarly, total water withdrawals could certainly begin to increase again, but many factors suggest this is unlikely in the long run. Significant expansion of irrigated agriculture, which dominates US water use, seems improbable, especially in the western US where almost all major rivers and aquifers are already tapped out—at the limits of their renewable and nonrenewable supplies. Another major driver of US freshwater use is power plant cooling, and a significant expansion of cooling demand also seems unlikely because of constraints on water withdrawals, even in relatively well-watered regions, and because efforts to move from central water-intensive thermal plants to less-water-intensive renewable systems are gaining traction. Certainly, some regions have passed the point of peak ecological water and efforts are now focused on how to restore some water for the environment, not how to take more out. In short, we think it possible that the United States is past the point of peak water and the focus of future water use efforts will be on improving efficiency of current uses and reallocating water from one existing user to another.
Conclusions: Implications of Peak Water
As the world anticipates a resource-constrained future, the specter of peak oil—a peaking in the production of oil—has been predicted. Real limits on water are far more worrisome, and far more difficult to evaluate, than limits on traditional nonrenewable resources such as petroleum. Water is fundamental for ecosystem health and for economic productivity, and for many uses it has no substitutes. This paper offers three separate definitions of peak water, for renewable and nonrenewable water systems and also introduces the concept of peak ecological water. We also raise the possibility that the United States has already passed the point of peak water.
The concept of peak water does not mean we will run out of water. Water is a renewable resource and is not consumed in the global sense: Hence, water uses within renewable peak limits can continue indefinitely. But not all water use is renewable; indeed some water uses are nonrenewable and unsustainable. Groundwater use beyond normal recharge rates follows a peak-oil type curve with a peak and then decline in water production. Such peak nonrenewable water problems are increasingly evident in major groundwater basins with critical levels of overdraft, such as the Ogallala and California’s Central Valley in the United States, the North China Plains, and in numerous states in India, such as Andhra Pradesh, Rajasthan, and Tamil Nadu. Peak ecological water refers to the point after which the cost of disruptions that occur in the ecological services that water provides exceeds the value provided by additional increments of water use by humans for economic purposes. Defined this way, many regions of the world have already surpassed peak ecological water—humans use more water than the ecosystem can sustain without significant deterioration and degradation.
The concepts around peak water are also important in driving some paradigm shifts in the use and management of water. There are growing efforts to quantify peak ecological limits and to develop policies to restore water for ecosystem services in basins where serious ecological disruptions have already been recognized. Improvements in the ability to identify groundwater basins suffering from nonrenewable withdrawals are increasing the pressure on water managers to reduce withdrawals to more sustainable levels, or to better integrate surface and groundwater management. And the realization that there are limits to peak renewable water use are forcing new discussions about improving water-use efficiency and developing innovative technologies for water treatment and reuse as alternatives to expanding traditional supply projects to further mine overtapped renewable water sources. The bad news is that we are increasingly reaching peak water limits. The good news is that recognizing and understanding these limits can stimulate innovations and behaviors that can reduce water use and increase the productivity of water, shifting water policy toward a more sustainable water future.
Acknowledgments.
Thanks to our colleagues at the Pacific Institute, including Heather Cooley and Nancy Ross, for comments and feedback as we were preparing this analysis. Thanks also to Professors Robert Glennon and Robert Wilkinson for reviewing the manuscript and offering thoughtful and helpful suggestions for improving it.
Footnotes
This contribution is part of the special series of Inaugural Articles by members of the National Academy of Sciences elected in 2006.
The authors declare no conflict of interest.
*Due to the law of conservation of energy, energy is never consumed—simply converted to another form. But in this case, the use of oil converts concentrated, high-quality energy into low-quality, unusable waste heat, effectively “consuming” the oil.
†Assuming a price equivalent to what industry and urban users pay for high-quality reliable municipal supplies.
References
- 1.Shiklomanov IA. Appraisal and assessment of world water resources. Water Int. 2000;25(1):11–32. [Google Scholar]
- 2.Gleick PH. The World’s Water 2006–2007. Washington, DC: Island Press; 2006. pp. 228–236. Data Table 2. [Google Scholar]
- 3.Postel SL, Daily GC, Ehrlich PR. Human appropriation of renewable fresh water. Science. 1996;271:785–788. [Google Scholar]
- 4.Bentley RW. Global oil and gas depletion: An overview. Energ Policy. 2002;30(3):189–205. [Google Scholar]
- 5.Duncan RC. Three world oil forecasts predict peak oil production. Oil Gas J. 2003;101(21):18–20. [Google Scholar]
- 6.Kerr RA. The looming oil crisis could arrive uncomfortably soon. Science. 2007;316:351. doi: 10.1126/science.316.5823.351. [DOI] [PubMed] [Google Scholar]
- 7.Bardi U. Peak oil: The four stages of a new idea. Energy. 2009;34(3):323–326. [Google Scholar]
- 8.Gleick PH. Soft water paths. Nature. 2002;418:373. doi: 10.1038/418373a. [DOI] [PubMed] [Google Scholar]
- 9.Falkenmark M, Lundqvist J, Widstrand C. Macro-scale water scarcity requires micro-scale approaches: Aspects of vulnerability in semi-arid development. Nat Resour Forum. 1989;13(4):258–267. doi: 10.1111/j.1477-8947.1989.tb00348.x. [DOI] [PubMed] [Google Scholar]
- 10.Lundqvist J, Gleick P. Comprehensive Assessment of the Freshwater Resources of the World. Sustaining Our Waters into the 21st Century. New York: United Nations Educational, Scientific, and Cultural Organization; 1997. pp. 1–51. [Google Scholar]
- 11.United Nations World Water Assessment Program. World Water Development Report: Water for People, Water for Life. Barcelona: United Nations World Water Assessment Program and Berghahn Books; 2003. pp. 1–575. [Google Scholar]
- 12.United Nations Environment Programme. Global Environmental Outlook 4: Environment for Development. Malta: United Nations Environment Programme; 2007. pp. 1–540. [Google Scholar]
- 13.Hubbert MK. Nuclear Energy and the Fossil Fuels. Houston: Shell Development Co.; 1956. pp. 1–44. [Google Scholar]
- 14.United States Energy Information Agency. International Petroleum Monthly. Washington, DC: 2008. http://www.eia.doe.gov/ipm/ [Google Scholar]
- 15.Gold R, Davis A. Oil Officials See Limit Looming on Production. Wall Street Journal. 2007. Nov 10, p. A-1.
- 16.Ehrlich P, Ehrlich A, Holdren JP. Ecoscience: Population, Resources, Environment. San Francisco: Freeman; 1977. [Google Scholar]
- 17.Tiwari VM, Wahr J, Swenson S. Dwindling groundwater resources in northern India, from satellite gravity observations. Geophys Res Lett. 2009;36:L18401. doi: 10.1029/2009GL039401. [Google Scholar]
- 18.Syed TH, Famiglietti J, Chambers DP. GRACE-based estimates of terrestrial freshwater discharge from basin to continental scales. J Hydrometeorol. 2009;10(1):22–40. [Google Scholar]
- 19.Nordhaus WD. The allocation of energy resources. Brookings Pap Eco Ac. 1973;1973(3):529–570. [Google Scholar]
- 20.Cooley H, Gleick PH, Wolff G. Desalination: With a Grain of Salt A California Perspective. Oakland, CA: Pacific Inst; 2006. [Google Scholar]
- 21.National Research Council. Desalination: A National Perspective. Washington, DC: National Academy Press; 2008. [Google Scholar]
- 22.Allan JA. SOAS Occasional Paper 22. London: School of Oriental and African Studies, University of London; 1999. Water in International Systems: A Risk Society Analysis of Regional Problemsheds and Global Hydrologies. [Google Scholar]
- 23.Chatterjee R, Purohit RR. Estimation of replenishable groundwater resources of India and their status of utilization. Curr Sci India. 2009;96(12):1581–1591. [Google Scholar]
- 24.Tiwari VM, Wahr J, Swenson S. Dwindling groundwater resources in northern India, from satellite gravity observations. Geophys Res Lett. 2009;36:L18401. doi: 10.1029/2009GL039401. [Google Scholar]
- 25.Daily GC, et al. Iss Ecol. 1997;1:1–18. [Google Scholar]
- 26.Daily GC, et al. The value of nature and the nature of value. Science. 2000;289:395–396. doi: 10.1126/science.289.5478.395. [DOI] [PubMed] [Google Scholar]
- 27.Gleick PH. Water in crisis: Paths to sustainable water use. Ecol Appl. 1998;8(3):571–579. [Google Scholar]
- 28.Postel SL, Daily GC, Ehrlich PR. Human appropriation of renewable fresh water. Science. 1996;271:785–788. [Google Scholar]
- 29.Katz D. In: The World’s Water 2006–2007. Gleick PH, editor. Washington, DC: Island Press; 2006. pp. 29–39. [Google Scholar]
- 30.Daily GC, et al. The value of nature and the nature of value. Science. 2000;289:395–396. doi: 10.1126/science.289.5478.395. [DOI] [PubMed] [Google Scholar]
- 31.Kenny JF, et al. Estimated Use of Water in the United States in 2005. Reston, VA: United States Geological Survey; 2009. Circular 1344 (see also the entire series for earlier years) [Google Scholar]
- 32.Gleick PH. Water use. Annu Rev Env Resour. 2003;28:275–314. [Google Scholar]
- 33.United States Energy Information Agency. Washington, DC: United States Energy Information Agency; 2009. US Field Production of Crude Oil, Independent Statistics and Analysis. [Google Scholar]
- 34.Shiklomanov IA. World Fresh Water Resources. In: Gleick PH, editor. Water in Crisis. Oxford: Oxford Univ Press; 1993. pp. 13–24. [Google Scholar]


